What Is a Crypto Market Correction?
A market correction in cryptocurrency is a significant decline in asset prices from a recent peak, typically defined as a pullback of 10% or more. In traditional equity markets, corrections of 10-20% are considered standard; declines exceeding 20% are classified as bear markets. In cryptocurrency, these thresholds function differently. Bitcoin has historically experienced corrections of 50% to over 90% even within broader bull markets — making conventional financial definitions inadequate for describing the true scale of crypto volatility.
Understanding market corrections is not merely academic. For investors, the ability to distinguish between a temporary correction and a structural breakdown — and to respond appropriately rather than emotionally — separates those who build long-term wealth from those who crystallize losses at the worst possible moment. This guide examines why crypto corrections happen, what history teaches us about their patterns, and how informed investors approach these periods.
The Scale of Historical Bitcoin Corrections
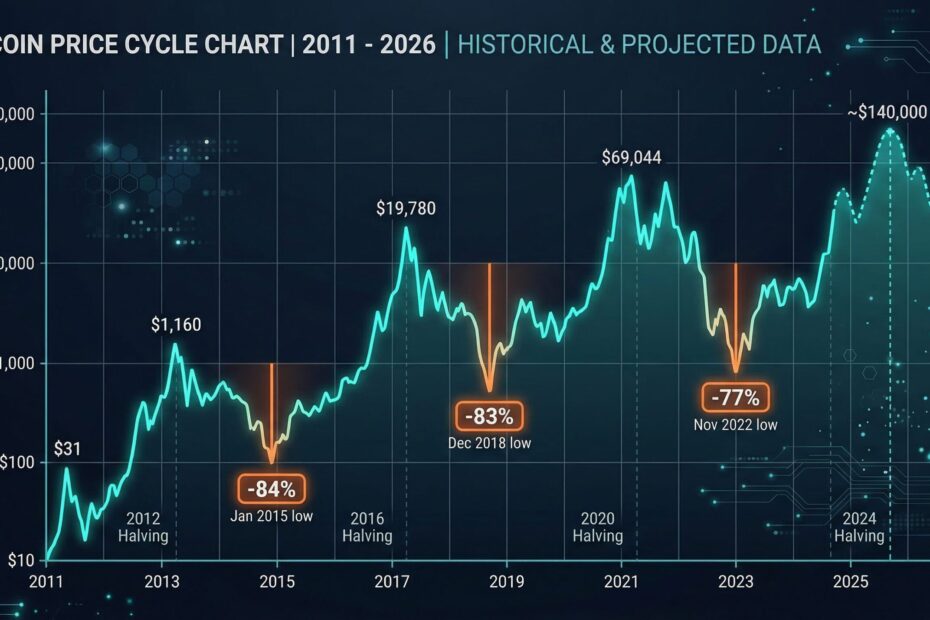
Bitcoin’s price history is defined by a pattern of extraordinary gains followed by severe drawdowns. Each cycle has been large enough to eliminate overleveraged participants and test the conviction of long-term holders, yet each bear market has ultimately been followed by a recovery to new all-time highs.
The major correction cycles:
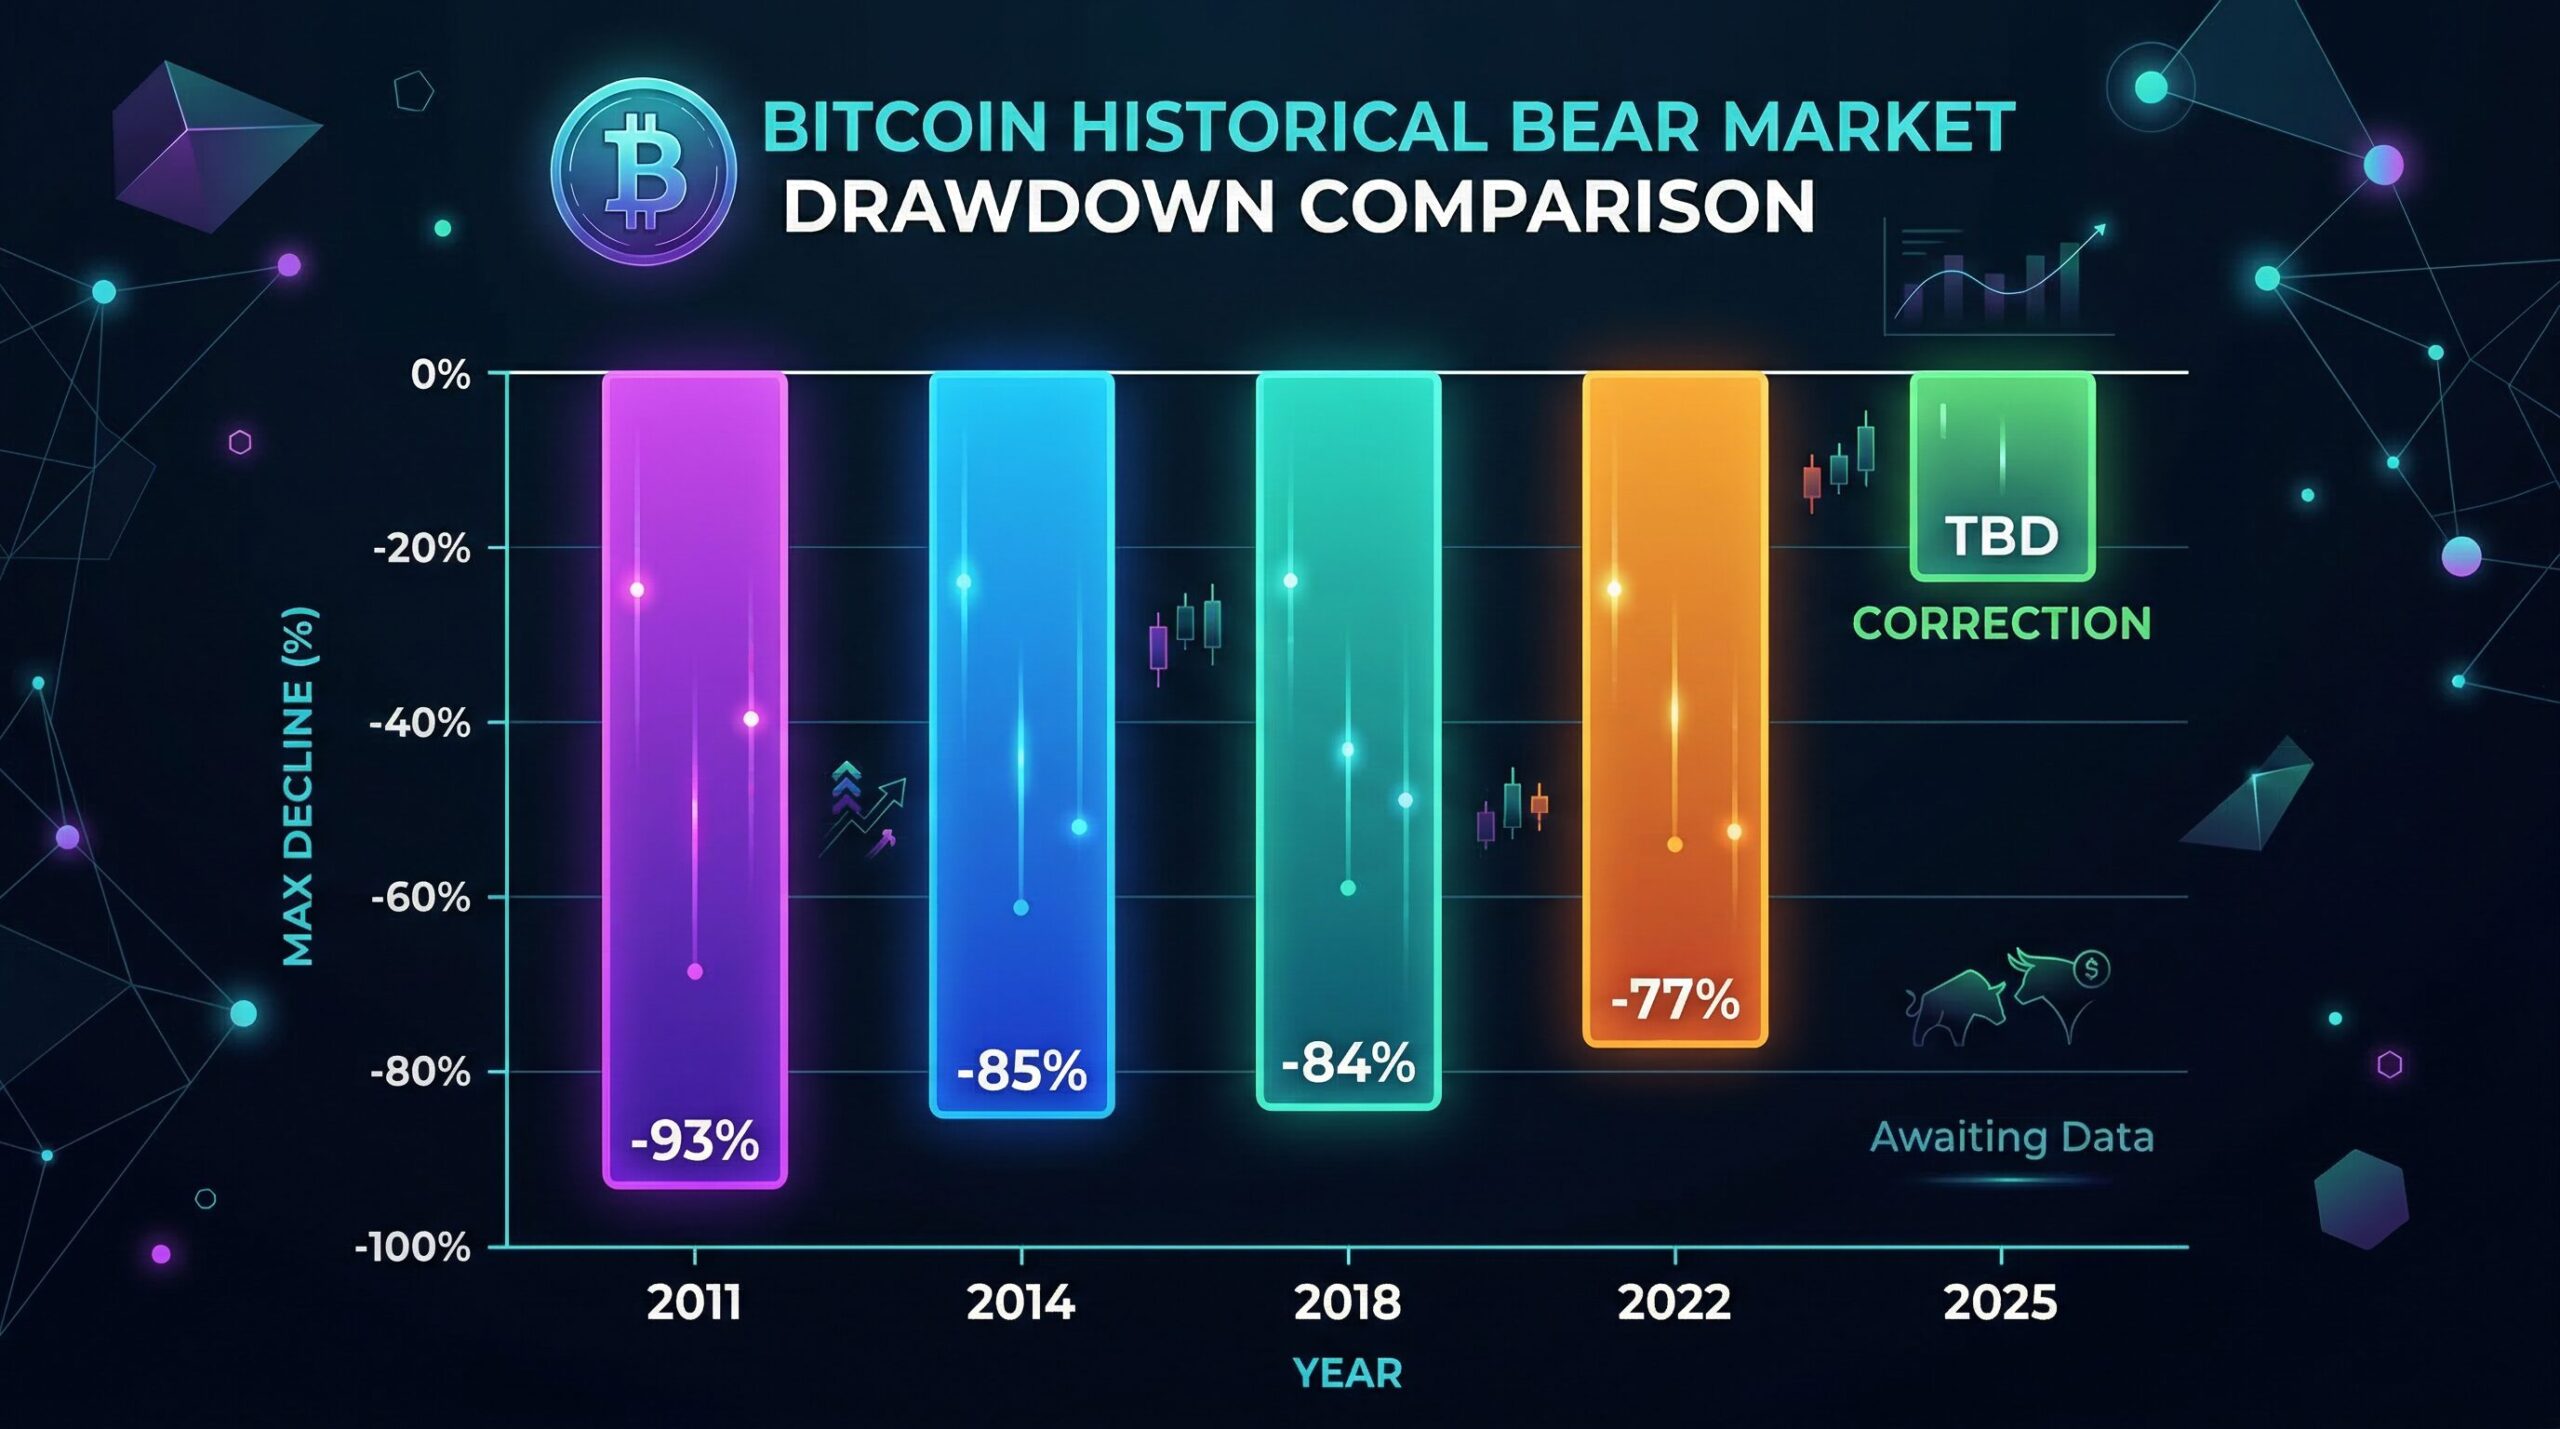
- 2011 crash: Bitcoin fell approximately 93% from its peak of $31, bottoming near $2. Recovery took roughly two years.
- 2013-2015 bear market: Following Bitcoin’s rise above $1,000, a combination of the Mt. Gox exchange collapse and Chinese regulatory restrictions triggered an 85% decline. Bitcoin fell from approximately $1,163 to $172 over 14 months.
- 2017-2018 correction: After Bitcoin reached nearly $20,000 in December 2017, the market entered an 84% correction, with Bitcoin falling to approximately $3,200 by December 2018. This crash coincided with a global regulatory crackdown on initial coin offerings (ICOs) and growing concerns about market manipulation.
- 2021-2022 bear market: Bitcoin reached $69,000 in November 2021, then declined 77% to approximately $15,476 by November 2022. The FTX collapse — in which an estimated $8 billion in customer funds were misappropriated — accelerated the final leg down and damaged institutional confidence significantly.
- 2025-2026 correction: After reaching an all-time high of $126,198 in October 2025, Bitcoin has corrected approximately 45-50% as of early 2026, briefly touching lows near $59,000 in February 2026 before stabilizing in the $65,000-$72,000 range. This represents a materially shallower drawdown than prior cycles, consistent with the market’s increasing maturation and institutional participation.
A notable pattern emerges across these cycles: maximum drawdown severity has decreased over time. From 93% in 2011 to 77% in 2022 to approximately 50% in the current cycle. This trend reflects Bitcoin’s growing market depth, institutional participation, and the dampening effect of regulated investment products like spot ETFs on extreme volatility.

Why Do Crypto Markets Correct? The Seven Key Drivers
1. Speculative Excess and Leverage Buildup
Cryptocurrency markets attract high levels of speculative activity. During bull markets, retail and institutional traders often use leverage — borrowing against their existing holdings to amplify potential gains. When prices fall even modestly, leveraged positions face automatic liquidation, which creates cascading sell pressure.
The pattern is self-reinforcing: falling prices trigger liquidations, which cause further price drops, which trigger more liquidations. During the correction that began in October 2025, over $2 billion in leveraged positions were liquidated in a short period, according to market data, amplifying what might otherwise have been a moderate pullback into a significant correction.
2. Macroeconomic Conditions and Monetary Policy
Bitcoin and the broader crypto market have become increasingly correlated with traditional risk assets — particularly technology stocks — over the past several years. As a result, macroeconomic shifts that pressure equities also pressure crypto assets.
Rising interest rates make risk-free assets like government bonds comparatively more attractive, reducing the appeal of high-risk assets including crypto. Tightening monetary policy by the Federal Reserve contributed significantly to the 2022 bear market. Conversely, expectations of monetary easing or liquidity expansion tend to support crypto prices. The 2025 bull market unfolded against a backdrop of Federal Reserve rate cuts and improving liquidity conditions.
Geopolitical tensions add another layer of macroeconomic uncertainty. Trade disputes, sanctions regimes, and currency crises can simultaneously push some investors toward Bitcoin as a neutral reserve asset while causing others to deleverage broadly across all risk assets.
3. Regulatory Actions and Policy Uncertainty
Government interventions have repeatedly triggered or accelerated crypto market corrections. Significant historical examples include:
- China’s 2021 ban on cryptocurrency mining and domestic trading, which erased roughly 50% of Bitcoin’s hashrate overnight and triggered a sharp price decline
- The SEC‘s legal actions against major exchanges including Coinbase and Binance beginning in 2023, which created uncertainty about which tokens might be classified as unregistered securities
- South Korea’s repeated discussions of crypto trading restrictions and taxation changes
Regulatory clarity — such as the passage of the US GENIUS Act in July 2025 and the SEC/CFTC joint interpretation issued in March 2026 — tends to reduce this source of volatility over time as legal frameworks become established.
4. Exchange Failures and Security Incidents
The centralized exchange ecosystem has been a recurring source of market-wide stress. The collapses of Mt. Gox (2014), Bitfinex hack (2016), QuadrigaCX (2019), and FTX (2022) each triggered significant market corrections and eroded trust in custodial platforms.
Security incidents at exchanges and protocols also affect prices. The $1.5 billion Bybit hack in early 2025 — the largest exchange hack in history at the time — reinforced security concerns and added selling pressure to an already-cautious market entering 2026.
5. Liquidity Fragmentation
Unlike centralized stock exchanges, cryptocurrency liquidity is distributed across hundreds of centralized and decentralized trading venues. This fragmentation means that market depth is inconsistent: an asset may have abundant liquidity on a major exchange but be thinly traded on a decentralized protocol. Large trades can cause disproportionate price movements when they encounter insufficient market depth — a phenomenon called price slippage — which then propagates across venues through arbitrage and panic.
Bitcoin’s daily price moves regularly exceed +/- 5%, compared to the S&P 500’s typical range of 0.5-2%. Between 2015 and 2025, Bitcoin’s average daily standard deviation was approximately 3.5%, compared to under 1% for major equity indices.
6. Psychological Factors: FOMO and FUD
Cryptocurrency markets are acutely sensitive to behavioral finance dynamics — specifically fear of missing out (FOMO) and fear, uncertainty, and doubt (FUD). During bull markets, FOMO drives investors to buy at escalating prices regardless of fundamental valuation. During corrections, FUD triggers panic selling that depresses prices well below levels justified by underlying fundamentals.
These emotional cycles are amplified by social media, where news — accurate or otherwise — spreads instantly and often without context. A single tweet from a prominent figure, a misleading headline, or an unverified rumor can move billions of dollars in market value within minutes. This sensitivity to narrative is particularly pronounced in retail-heavy markets.
7. The Four-Year Halving Cycle
Bitcoin’s built-in halving mechanism — which reduces new supply by 50% every four years — has historically been the underlying driver of multi-year bull and bear market cycles. The pattern has been remarkably consistent:
Bull markets typically peak 12-18 months after a halving event, as reduced supply meets sustained or growing demand. Bear markets then follow as the cycle top triggers profit-taking, leverage liquidation, and retail capitulation. Recovery phases historically take 12-24 months before the next halving-driven cycle begins.
The 2024 halving reduced block rewards to 3.125 BTC. The pattern suggests a potential cycle bottom somewhere in 2026, with the next bull market building into the 2028 halving. However, institutional participation and regulatory developments make exact cycle timing less predictable than in earlier periods.
How Corrections Differ From Bear Markets
Not every correction is a bear market, and understanding the distinction matters for investment decision-making. In crypto, the following general framework applies:
- Correction (10-30% decline): Often brief, sometimes recovering within days or weeks. Common even during strong bull markets. Frequently triggered by profit-taking, leveraged liquidations, or short-term news events.
- Severe correction (30-50% decline): More sustained, typically lasting weeks to months. May indicate a cycle top, though not definitively. Requires more significant catalysts to reverse.
- Bear market (50%+ decline): Multi-month or multi-year decline from a market peak. Historically accompanied by high-profile failures (exchange collapses, major hacks), regulatory crackdowns, or macroeconomic tightening. Recovery to new highs has taken between one and three years in prior Bitcoin cycles.
The Role of Stablecoins During Corrections
One significant development in the 2025-2026 market cycle has been the increased role of stablecoins as a within-ecosystem safe harbor during volatility. Rather than exiting crypto entirely when prices fall, many traders rotate assets into stablecoins — dollar-pegged digital assets — to preserve capital while remaining positioned to re-enter the market during recoveries.
This behavior was evident during the 2025 market turbulence: while the combined market capitalization of major cryptocurrencies fell by 18.6%, the stablecoin market reached a record market capitalization of $226.1 billion. USD Coin (USDC) alone added $16.1 billion in market value, as traders sought stability without abandoning the digital asset ecosystem entirely.
The GENIUS Act, signed into US law in July 2025, established the first federal regulatory framework for stablecoins, requiring 100% reserve backing with liquid assets and monthly public reserve disclosures. This regulatory clarity is expected to accelerate institutional stablecoin adoption and further develop their role as on-ramps and safe havens within the crypto ecosystem.
How Experienced Investors Approach Corrections
Distinguishing Noise from Signal
The most common mistake during corrections is treating short-term price action as definitive evidence of a long-term trend change. Experienced investors evaluate whether the fundamental thesis for an asset has changed — not just whether the price has fallen. Bitcoin falling 30% does not change the fact that its supply is capped at 21 million coins, that the halving schedule remains intact, or that institutional adoption continues to grow. Price and value diverge significantly in the short term.
Dollar-Cost Averaging
Rather than attempting to time market bottoms — which even professional traders rarely achieve consistently — many long-term Bitcoin investors employ dollar-cost averaging (DCA): purchasing a fixed dollar amount at regular intervals regardless of price. This strategy automatically results in buying more Bitcoin when prices are low and less when prices are high, lowering the average cost basis over time without requiring accurate market timing.
Position Sizing and Risk Management
Staying solvent during a correction requires not being over-allocated to begin with. Financial advisors frequently recommend limiting total crypto exposure to 5-10% of an investment portfolio for most investors — a level where a 50% decline in crypto assets reduces the overall portfolio by 2.5-5%, which is significant but not catastrophic.
Within a crypto allocation, diversification across assets with different risk profiles (large-cap Bitcoin and Ethereum versus mid-cap altcoins versus stablecoins) reduces the impact of any single asset’s decline on the overall portfolio.
Avoiding Leveraged Exposure
The most reliable way to be forced to sell during a correction is to use leverage. Leveraged positions face automatic liquidation when prices fall to a threshold, often at exactly the worst moment. Historical data shows that the majority of traders using leverage in crypto markets lose money, particularly during volatile periods. For long-term investors, unlevered spot positions allow the holder to wait out corrections without being forced out.
What History Tells Us About Recovery
Every Bitcoin bear market in history has been followed by recovery to new all-time highs. This track record does not guarantee future performance, but it provides important context for interpreting current market conditions.
Historical recovery statistics from major Bitcoin drawdowns:
- 2011 (-93%): Recovery to prior high took approximately 2 years
- 2014-2015 (-85%): Recovery to prior high took approximately 3 years
- 2018 (-84%): Recovery to prior high took approximately 2 years
- 2022 (-77%): Recovery to prior high took approximately 14 months (to December 2024)
A consistent pattern is that recoveries have accelerated with each cycle, likely reflecting growing market depth, improved infrastructure, and increasing institutional participation that provides buying support at lower price levels.
Analysts at Glassnode noted in early 2026 that Bitcoin’s Realized Profit/Loss Ratio — a metric tracking whether the market is in a net loss-realization regime — fell below 1 for the first time since 2022, consistent with historical patterns preceding market bottoms. Historical data shows that periods below this threshold have lasted approximately six months before recovery.
The Maturing Market: Corrections in 2026 vs. Earlier Cycles
The 2025-2026 correction cycle has several characteristics that distinguish it from prior bear markets, reflecting the market’s increasing maturity:
Shallower drawdown: The current correction of approximately 45-50% is significantly less severe than any prior Bitcoin bear market, consistent with the trend of diminishing maximum drawdowns as the market matures and institutional participation deepens.
Faster news absorption: Rather than panic-driven mass exits, the 2025-2026 market saw many institutional holders selectively reduce exposure rather than capitulate entirely, suggesting a more disciplined investor base.
Structural support from ETFs: US spot Bitcoin ETFs attracted over $64 billion in inflows during 2025. Even as outflows exceeded $660 million in periods of correction, the structural demand created by ETFs provides a floor that did not exist in prior bear markets.
Stablecoin rotation rather than exit: The record growth in stablecoin market capitalization during 2025 turbulence indicates capital is staying within the digital asset ecosystem rather than fully exiting to traditional markets.
Frequently Asked Questions
Is a 50% Bitcoin correction considered extreme?
By historical Bitcoin standards, a 50% correction is moderate. Prior bear markets have produced declines of 77-93% from peak values. The current cycle’s ~45-50% drawdown is shallower than any prior major bear market, consistent with the trend of declining drawdown severity as the market matures.
How long do crypto bear markets typically last?
Historical Bitcoin bear markets have lasted between 12 months and 3 years from peak to recovery of prior highs. The 2022 bear market was the shortest on record at approximately 14 months. Increasing institutional participation and improved market infrastructure may continue to compress recovery timelines.
Should I sell during a crypto correction?
This depends entirely on individual circumstances including investment horizon, risk tolerance, and financial situation. This article does not constitute financial advice. Generally, investors with long time horizons who are not using leverage have historically been served by holding through corrections rather than selling at lows, but past performance does not guarantee future results.
What causes some altcoins to fall more than Bitcoin during corrections?
Altcoins typically have lower market capitalization and liquidity than Bitcoin, making them more sensitive to changes in market sentiment and more vulnerable to sell-offs. During the 2025 correction, Ethereum declined approximately 45% and Solana fell 34% from their respective peaks, compared to Bitcoin’s shallower decline — a common pattern where smaller assets correct more severely.
Conclusion
Crypto market corrections are not anomalies — they are a defining feature of the asset class, rooted in its speculative nature, liquidity fragmentation, leverage dynamics, and sensitivity to regulatory and macroeconomic developments. Understanding their causes, historical patterns, and typical recovery trajectories transforms them from sources of panic into navigable features of the investment landscape.
The data from seventeen years of Bitcoin market cycles consistently shows two things: corrections are inevitable, and they have consistently been followed by recoveries to new price highs. Whether this pattern continues depends on whether the fundamental value proposition of Bitcoin — scarcity, decentralization, permissionless access — continues to attract capital over time. Based on the structural developments of 2024-2026, including US spot ETF adoption, the Strategic Bitcoin Reserve, and global regulatory clarity, the institutional infrastructure supporting that value proposition has never been stronger.