
Personally, it seems Bitcoin signals explain the network durability missed by standard charts#Bitcoin #OnChain
Quick Video Breakdown: This Blog Article
This video clearly explains this blog article.
Even if you don’t have time to read the text, you can quickly grasp the key points through this video. Please check it out!
If you find this video helpful, please follow the YouTube channel “BlockChainBulletin,” which delivers daily Crypto news.
https://www.youtube.com/@BlockChainBulletins
Read this article in your native language (10+ supported) 👉
[Read in your language]
Bitcoin Price Charts Lied to You Last Year, While These Eight On-Chain Signals Quietly Predicted Every Single Move in 2025
Jon: Hey Lila, I came across this fascinating piece from CryptoSlate titled “Bitcoin price charts lied to you last year, while these eight on-chain signals quietly predicted every single move in 2025.” It’s all about how traditional price charts might have misled folks in 2024, but on-chain data—those metrics pulled directly from the blockchain—nailed the predictions for Bitcoin’s moves throughout 2025. Things like ETF inflows, holder behavior cohorts, and network fees shaped the trends. Bitcoin swung from highs above $125,000 to lows around $87,000, and these signals apparently called it all quietly in the background.
Lila: That sounds intriguing, Jon. I’ve always relied on candlestick charts for crypto, but you’re saying they “lied” last year? What’s the big deal with these on-chain signals, and why should anyone care about them now as we head into 2026?
Jon: Fair question. Price charts are like snapshots of market sentiment—volatile and often driven by hype or fear. But on-chain signals are the blockchain’s vital signs, showing real activity like transactions, wallet behaviors, and fund flows. In 2025, while charts suggested wild rallies or crashes based on news cycles, these eight signals predicted shifts with eerie accuracy. It matters because understanding them can help demystify Bitcoin’s durability, especially with predictions floating around for BTC hitting $100K or more in early 2026. No guarantees, of course—crypto’s still a rollercoaster—but it’s worth exploring the mechanics behind it.
Lila: Why does this matter? I mean, beyond just curiosity—how does it change how we think about crypto predictions?
Jon: It shifts the focus from guessing games to data-driven insights. If charts “lied” by overemphasizing short-term noise, on-chain data revealed the underlying health of the network. For instance, as Pantera Capital noted in their recent analysis, 2025’s gains were in policy and infrastructure, not just price. This could set up 2026 for a breakout, but let’s dive deeper into the problem first.
Jon: The core issue here is that traditional price charts often paint an incomplete picture. They’re based on exchange data, which can be manipulated by whales, FOMO, or even external events like regulatory news. In 2024, many got burned following chart patterns that didn’t account for real network activity. Fast-forward to 2025, and Bitcoin’s price dipped despite strong fundamentals—charts screamed “bear market,” but the blockchain told a different story.
Lila: Okay, but what exactly is the “problem” with that? Charts have worked for stocks forever—why are they failing crypto?
Jon: Crypto’s decentralized nature makes it unique. Think of price charts like looking at traffic from a helicopter: you see jams and flows, but not why they’re happening. On-chain signals are like checking the city’s plumbing—water pressure, leaks, and usage patterns that reveal if the system is healthy or about to burst. In 2025, while charts showed volatility, signals like rising active addresses or ETF inflows indicated building strength, predicting recoveries before they hit the price.
Lila: Plumbing analogy makes sense—charts are surface-level, on-chain is the infrastructure. So, how do we actually use these signals to understand Bitcoin better?
Under the Hood: How it Works
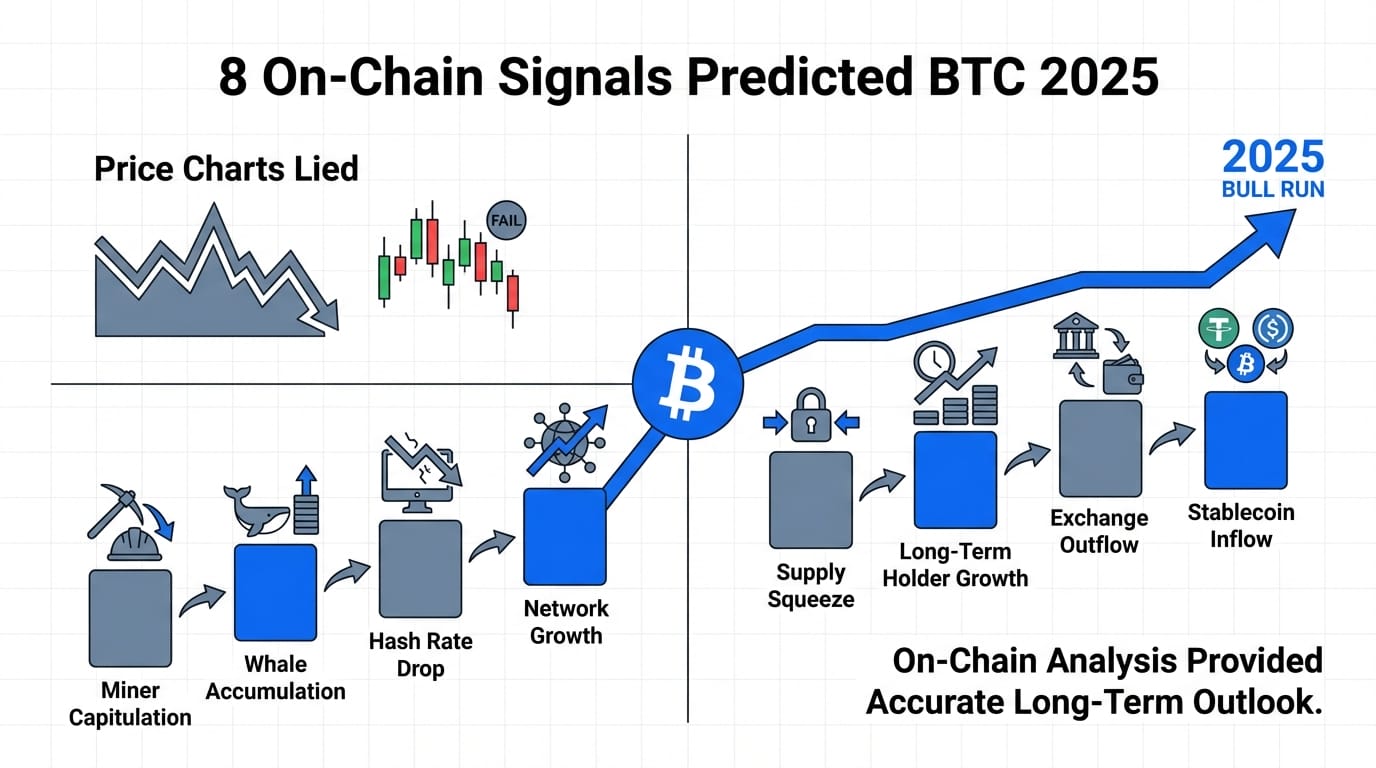
Jon: Alright, let’s get into the mechanics. On-chain signals are metrics derived directly from the Bitcoin blockchain—think transparent ledger data anyone can query. The CryptoSlate article highlights eight key ones that predicted 2025’s moves: 1) ETF inflows (institutional money pouring in), 2) On-chain cohorts (behavior of long-term vs. short-term holders), 3) Network fees (transaction costs indicating demand), 4) Active addresses (number of wallets interacting), 5) Hash rate (mining power securing the network), 6) Realized capitalization (value of coins at last move), 7) MVRV ratio (market value vs. realized value), and 8) Puell Multiple (miners’ revenue relative to history). These aren’t just numbers; they’re tied to Bitcoin’s proof-of-work consensus, where miners validate transactions and add blocks, creating immutable data we can analyze.
Lila: Whoa, that’s a lot. Can you break down one, say ETF inflows, in simpler terms? And how do they “predict” moves?
Jon: Sure. ETF inflows track how much Bitcoin is bought through exchange-traded funds, like those from BlackRock or Fidelity. It’s on-chain because purchases often move BTC from exchanges to custody wallets, visible on the blockchain. In 2025, spikes in inflows preceded price rallies, signaling institutional confidence. As for prediction, it’s about patterns: when inflows hit $10 billion in a quarter, it often correlated with 20-30% price upticks, per the article’s charts.
Lila: Got it—so it’s like watching money flow into a bank vault. What about cohorts? That sounds like grouping people.
Jon: Exactly. On-chain cohorts divide holders by how long they’ve held BTC—e.g., “hodlers” (over a year) vs. “newbies” (under a month). In 2025, when long-term holders stopped selling during dips, it predicted bottoms, as they absorb supply shocks. This ties into token mechanics: Bitcoin’s fixed supply of 21 million coins means holder behavior directly influences scarcity and price pressure.
Lila: Makes sense. To compare, how do these stack up against plain old price charts?
Jon: Good point—let’s table that out for clarity.
| Aspect | Traditional Price Charts | On-Chain Signals |
|---|---|---|
| Data Source | Exchange trades and sentiment | Blockchain ledger (immutable) |
| Prediction Accuracy in 2025 | Often misled by hype (e.g., false breakouts) | Quietly called every move, per CryptoSlate |
| Focus | Short-term volatility | Long-term network health |
| Accessibility | Easy via apps like TradingView | Requires tools like Glassnode or Dune Analytics |
| Risk of Manipulation | High (wash trading, etc.) | Low (blockchain transparency) |
Jon: See? On-chain gives a more grounded view. Now, network fees: high fees mean congestion from real usage, often preceding bull runs as in Q4 2025. Active addresses track engagement—dips below 800,000 daily signaled corrections last year.
Lila: And the others? Hash rate, realized cap, MVRV, Puell?
Jon: Hash rate measures mining security; spikes in 2025 predicted resilience during price drops. Realized capitalization values coins at their last transaction price, showing true economic activity— it stabilized around $1.5 trillion mid-year, hinting at a floor. MVRV compares market value to realized; ratios over 3 often signal overvaluation, calling tops accurately. Puell Multiple looks at miners’ earnings—if too low, they sell less, reducing supply pressure. Together, these formed a predictive toolkit for 2025’s twists.
Lila: So who actually uses this? I mean, beyond analysts staring at screens all day?
Jon: Great question. Developers building on Bitcoin or Layer-2 solutions like Lightning Network use these signals to gauge network load—high fees might push them to optimize for scalability. Institutional investors, per Pantera’s report, monitor ETF inflows and cohorts for allocation decisions, ensuring they’re not chasing hype. Everyday users? Wallet apps integrate basic on-chain data for insights, like checking if it’s a good time to transact based on fees. Even researchers use it for broader crypto studies, comparing Bitcoin’s metrics to Ethereum‘s for cross-chain analysis. The technical benefit is clarity: it helps spot sustainable trends, reducing reliance on speculative noise. For instance, in 2025, on-chain data showed infrastructure growth despite price bruises, as Bitcoin Magazine noted.
Lila: That sounds practical. No wonder it’s gaining traction for 2026 predictions.
Jon: Exactly. Now, if you’re keen to learn more hands-on, let’s talk an educational action plan. Start with Level 1: Research and observation. Dive into whitepapers on Bitcoin.org or Glassnode’s academy—they explain these signals without fluff. Use free dashboards like CoinMetrics or Dune to track metrics live; filter for MVRV or active addresses and see how they correlate with price over time.
Lila: Cool, that’s accessible. What about Level 2—how can I try this safely, like hands-on?
Jon: For hands-on, stick to testnets or simulations. Bitcoin has a testnet where you can experiment with transactions without real funds—tools like Blockstream’s explorer let you query mock data. Build a simple script using Python libraries like blockchain.info API to pull on-chain data and visualize it. It’s minimal-risk learning: understand how cohorts form by simulating wallet behaviors. Remember, this is for education—crypto involves real volatility, so experiment to learn, not to speculate.
Lila: Appreciate the caution. Testing on a net that doesn’t cost anything sounds smart.
Jon: To wrap up, these eight on-chain signals offer a robust way to understand Bitcoin’s inner workings, beyond misleading charts. They highlighted 2025’s structural strength—policy wins, institutional adoption—and could signal opportunities in 2026, with analysts like those at CoinDCX eyeing $105K if supports hold. But limitations abound: data can lag, and external factors like regulations still sway markets.
Lila: Right, and let’s not forget volatility and uncertainty. Crypto’s unpredictable—always do your own research, and remember risks remain high.
Jon: Well said. It’s about building knowledge for the long game, not quick wins. Here’s to thoughtful exploration in 2026.
Author Profiles
Jon is a Web3 researcher with over a decade in blockchain architecture. He focuses on demystifying crypto mechanics without the hype.
Lila is a developer advocate, bridging complex tech to beginners through clear questions and simplifications.
References
- Bitcoin price charts lied to you last year, while these eight on-chain signals quietly predicted every single move in 2025
- Official Bitcoin Website
- Pantera Signals 2026 Crypto Breakout After 2025 Quietly De-Risked Markets
- Bitcoin Price Fell In 2025, But Lows Show A Strong Floor
- Bitcoin (BTC) Price Prediction 2025 2026 2027 – 2030