Bitcoin does not move randomly. Since 2011, its price has followed a recognizable pattern — a roughly four-year cycle of accumulation, explosive growth, euphoric peaks, and painful corrections. Understanding this cycle does not guarantee investment success, but it provides essential context for interpreting Bitcoin’s price movements and separating signal from noise.
This guide explains Bitcoin’s market cycle mechanics, the role of halving events, what each phase looks like, why the pattern has persisted, and where the market stands as of early 2026.

What Is a Bitcoin Market Cycle?
A Bitcoin market cycle is a recurring sequence of price phases that repeats approximately every four years. Each complete cycle runs from one bull market peak to the next, encompassing the subsequent bear market, recovery, and new all-time high. The cycle is closely tied to — though not perfectly determined by — Bitcoin’s halving events, which occur every 210,000 blocks and cut the rate of new Bitcoin issuance in half.
Bitcoin has now completed four full market cycles, with a fifth underway. The historical record provides a data set that, while limited, reveals patterns consistent enough to be studied seriously by institutional analysts, quantitative traders, and long-term investors.
Key institutions including Fidelity Investments and S&P Global have published research acknowledging Bitcoin’s cyclical price behavior, though all note that past cycles do not guarantee future results.
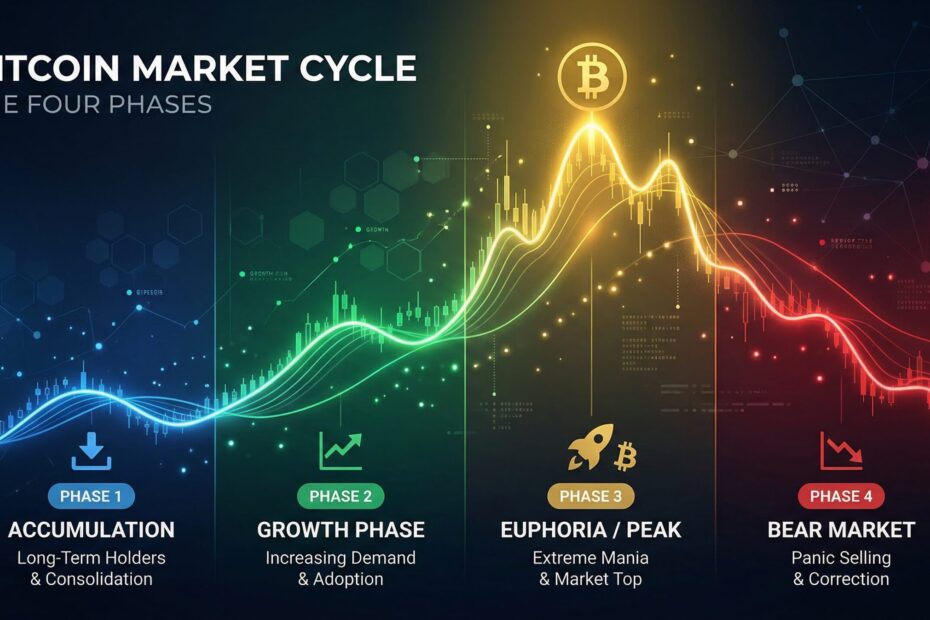
The Four Phases of the Bitcoin Cycle
Phase 1: Accumulation (Bear Market Bottom)
The accumulation phase follows a major price crash. Retail sentiment is deeply negative — the asset is widely described as dead, obsolete, or permanently broken. Trading volumes decline. Mainstream media attention drifts away. Price action is characterized by sideways movement with occasional minor rallies and drops.
This phase is psychologically the most difficult for investors. Remaining invested requires conviction that the asset has fundamental value despite market consensus suggesting otherwise. Ironically, accumulation phases represent the highest risk-adjusted entry points for long-term investors.
Historically, Bitcoin’s accumulation phases have coincided with or immediately followed Bitcoin halvings — the programmatic supply reductions that occur every four years.
Phase 2: Recovery and Growth
The growth phase begins as price starts trending higher from its bear market low. Early in this phase, the move is dismissed as a “dead cat bounce” by skeptics. Volume gradually increases. On-chain metrics like active addresses, transaction volumes, and exchange inflows begin trending upward.
Media coverage becomes increasingly positive as price reclaims previously key levels. New entrants begin buying, initially cautiously. This phase often sees Bitcoin’s price reclaim its previous all-time high — a milestone that historically marks a major psychological turning point and accelerates momentum.
Phase 3: Bubble/Euphoria (Bull Market Peak)
This phase is also the most deceptive: the market feels “obviously” going higher because prices have been rising for months. In reality, bull market peaks historically form when the largest number of buyers have entered — and there are fewer new buyers left to sustain the momentum.
Historically, Bitcoin’s bull market peaks have been followed by corrections of 77–85% from the peak.
Phase 4: Crash and Bear Market
The crash phase begins with rapid, often unexpected selling pressure that can cut prices 30–50% within weeks. Initial drops are dismissed as healthy corrections — “buy the dip” sentiment remains strong. But as the trend becomes unmistakable, capitulation accelerates. Leveraged positions are liquidated in cascading sell-offs, as the derivatives market structure amplifies downward moves.
Bear markets are prolonged and painful. Price typically finds its bottom 12–18 months after the peak, often lower than most participants expect. The bear market ends when the last hopeful buyers have sold and the price finds support among long-term “hodlers” who are unwilling to sell at any price.
The Historical Record: Four Cycles Documented
Cycle 1: 2011–2015
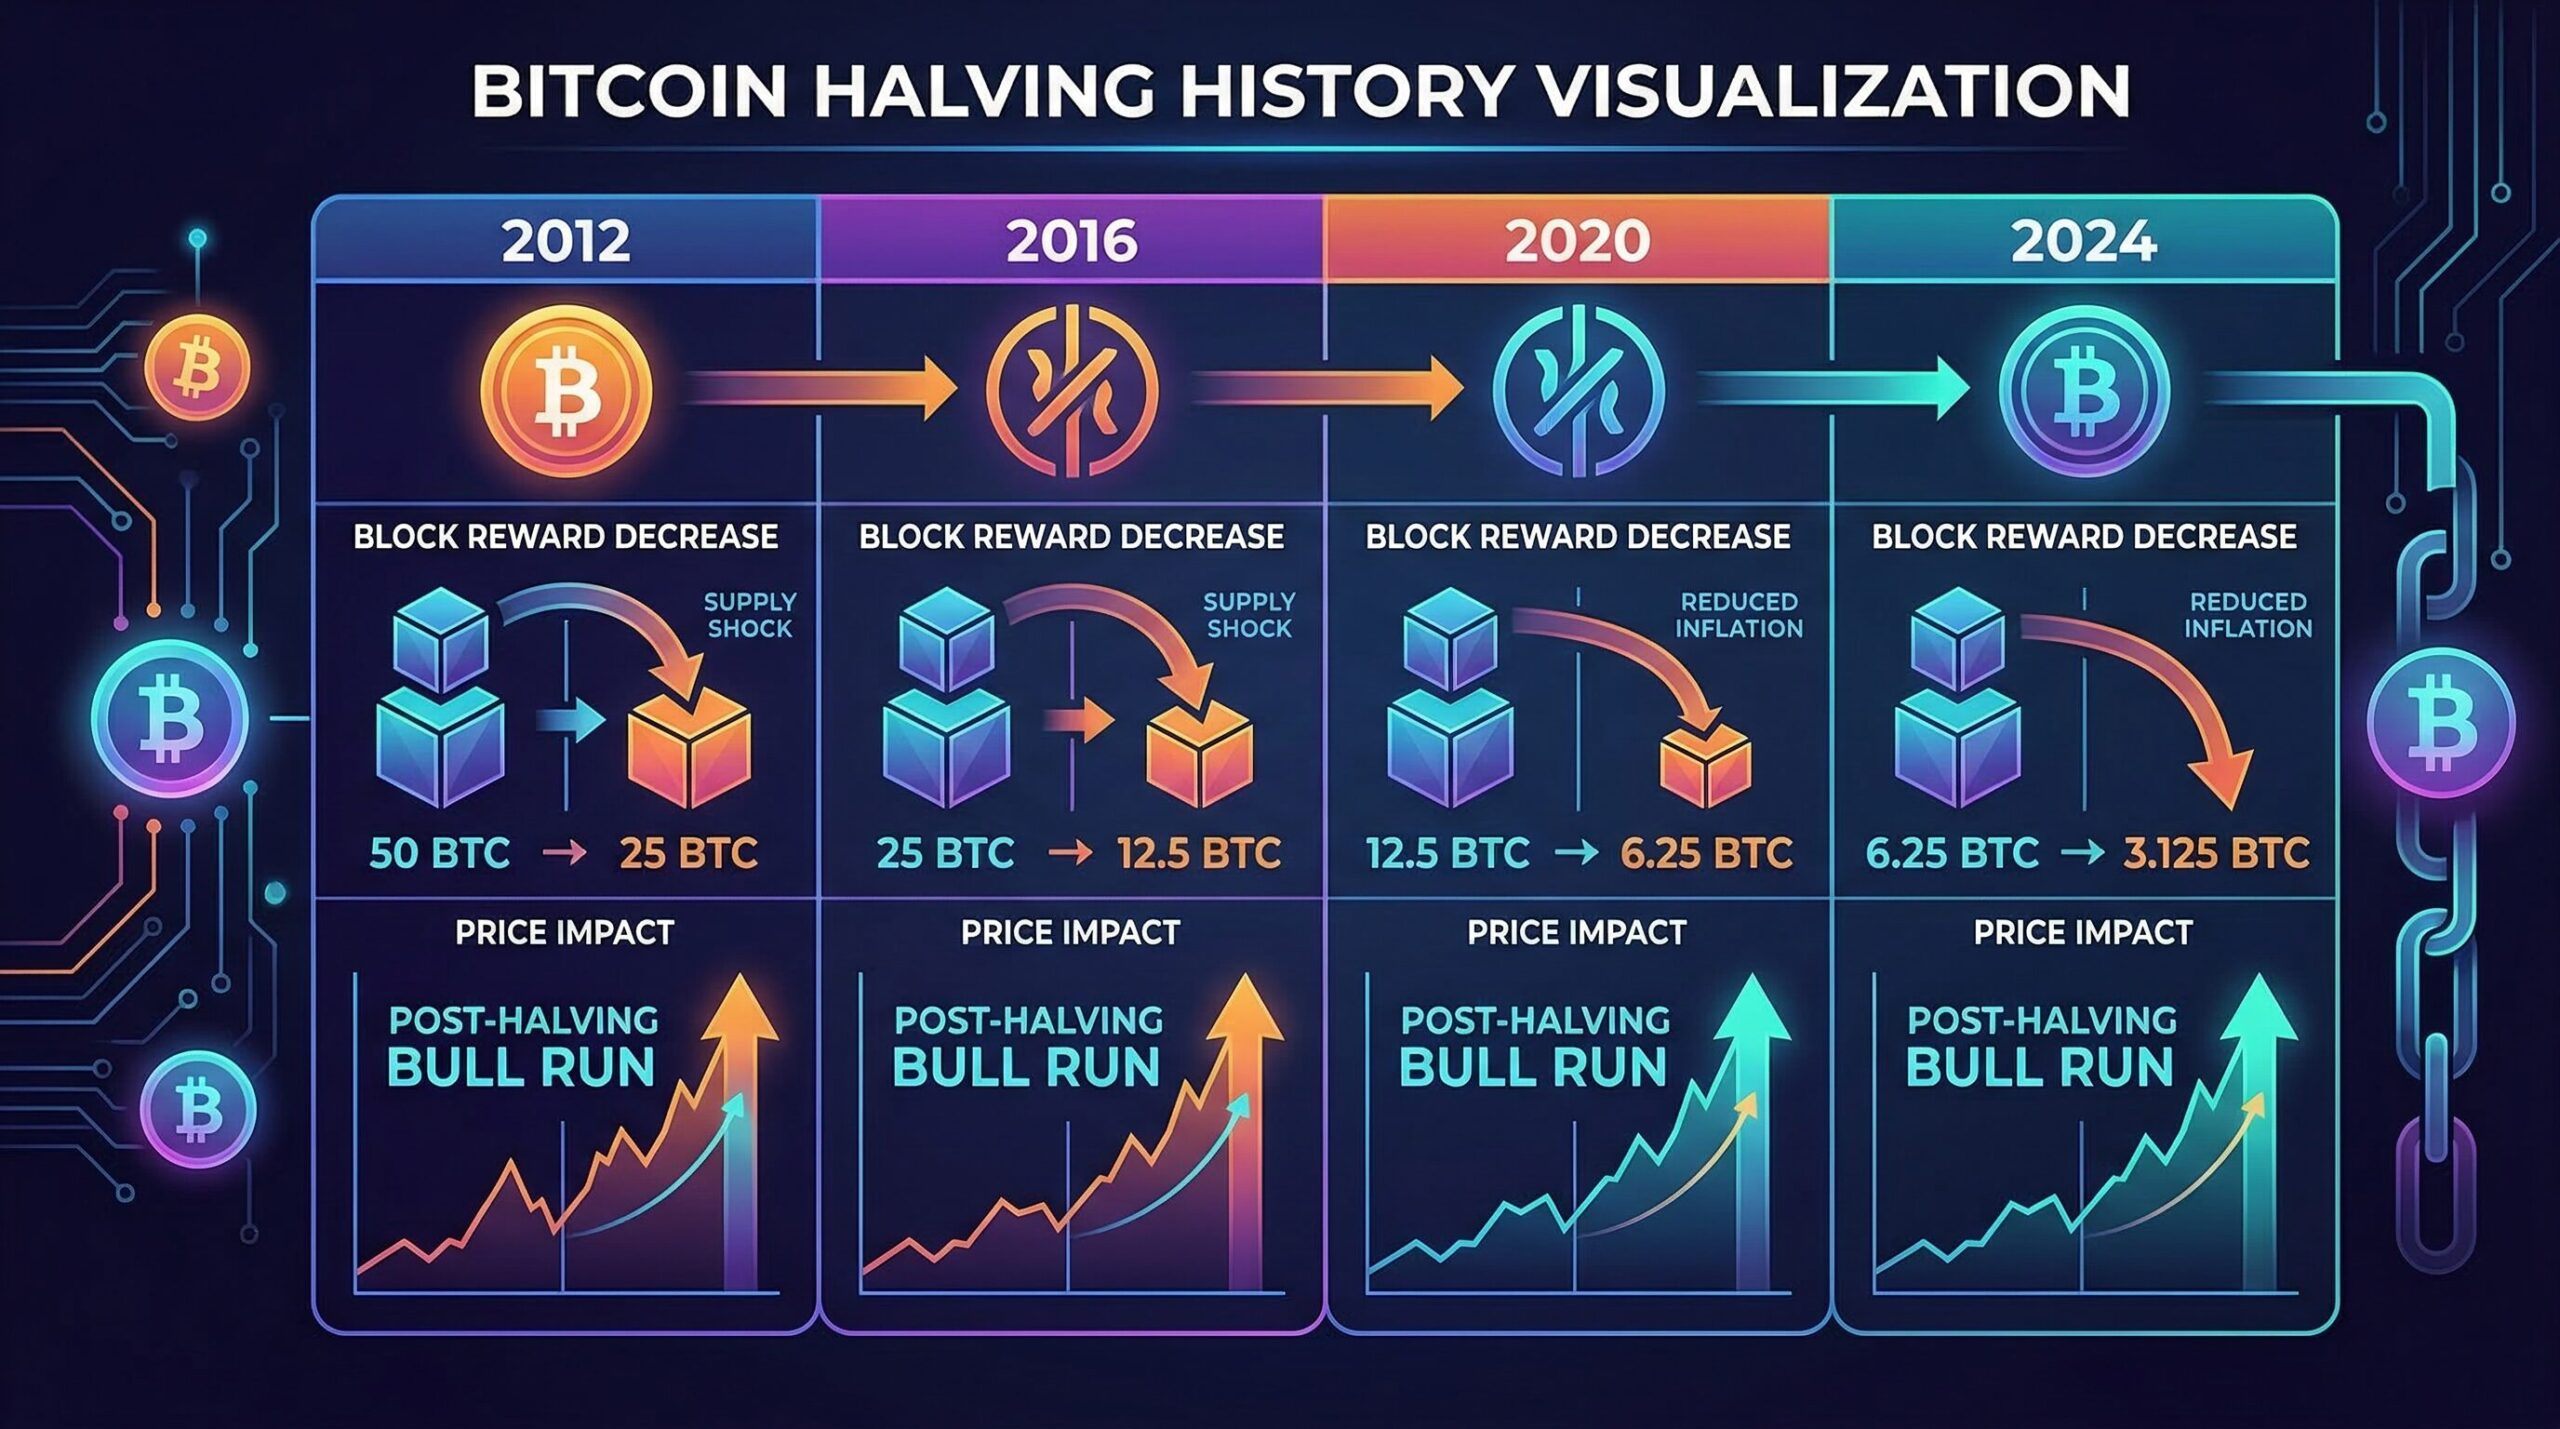
Bitcoin’s first recognizable major cycle began in 2011. Price peaked at $1,150 in November 2013, declined to a bear market low of $152 in January 2015 — a drawdown of approximately 87%. The first halving occurred in November 2012, reducing the block reward from 50 BTC to 25 BTC. This cycle established the basic pattern that subsequent cycles have broadly followed.
Cycle 2: 2015–2018
Recovery from the 2015 lows built steadily. Bitcoin surpassed its previous all-time high in early 2017, then entered a parabolic acceleration fueled by the Initial Coin Offering (ICO) boom and mainstream retail interest. The second halving occurred in July 2016 (12.5 BTC reward), preceding the bull run by roughly 18 months. BTC peaked at $19,800 in December 2017, then crashed to $3,200 by December 2018 — an 84% drawdown over 12 months.
Cycle 3: 2018–2022
The third cycle introduced institutional participation as a major variable. The bear market bottomed in November 2022 at $15,500. The third halving occurred in May 2020 (6.25 BTC reward). Bitcoin’s 2020–2021 bull run coincided with unprecedented monetary stimulus from central banks globally, which likely contributed to its scale. BTC reached $69,000 in November 2021, then fell 78% to $15,500 by November 2022.
Cycle 4: 2022–Present
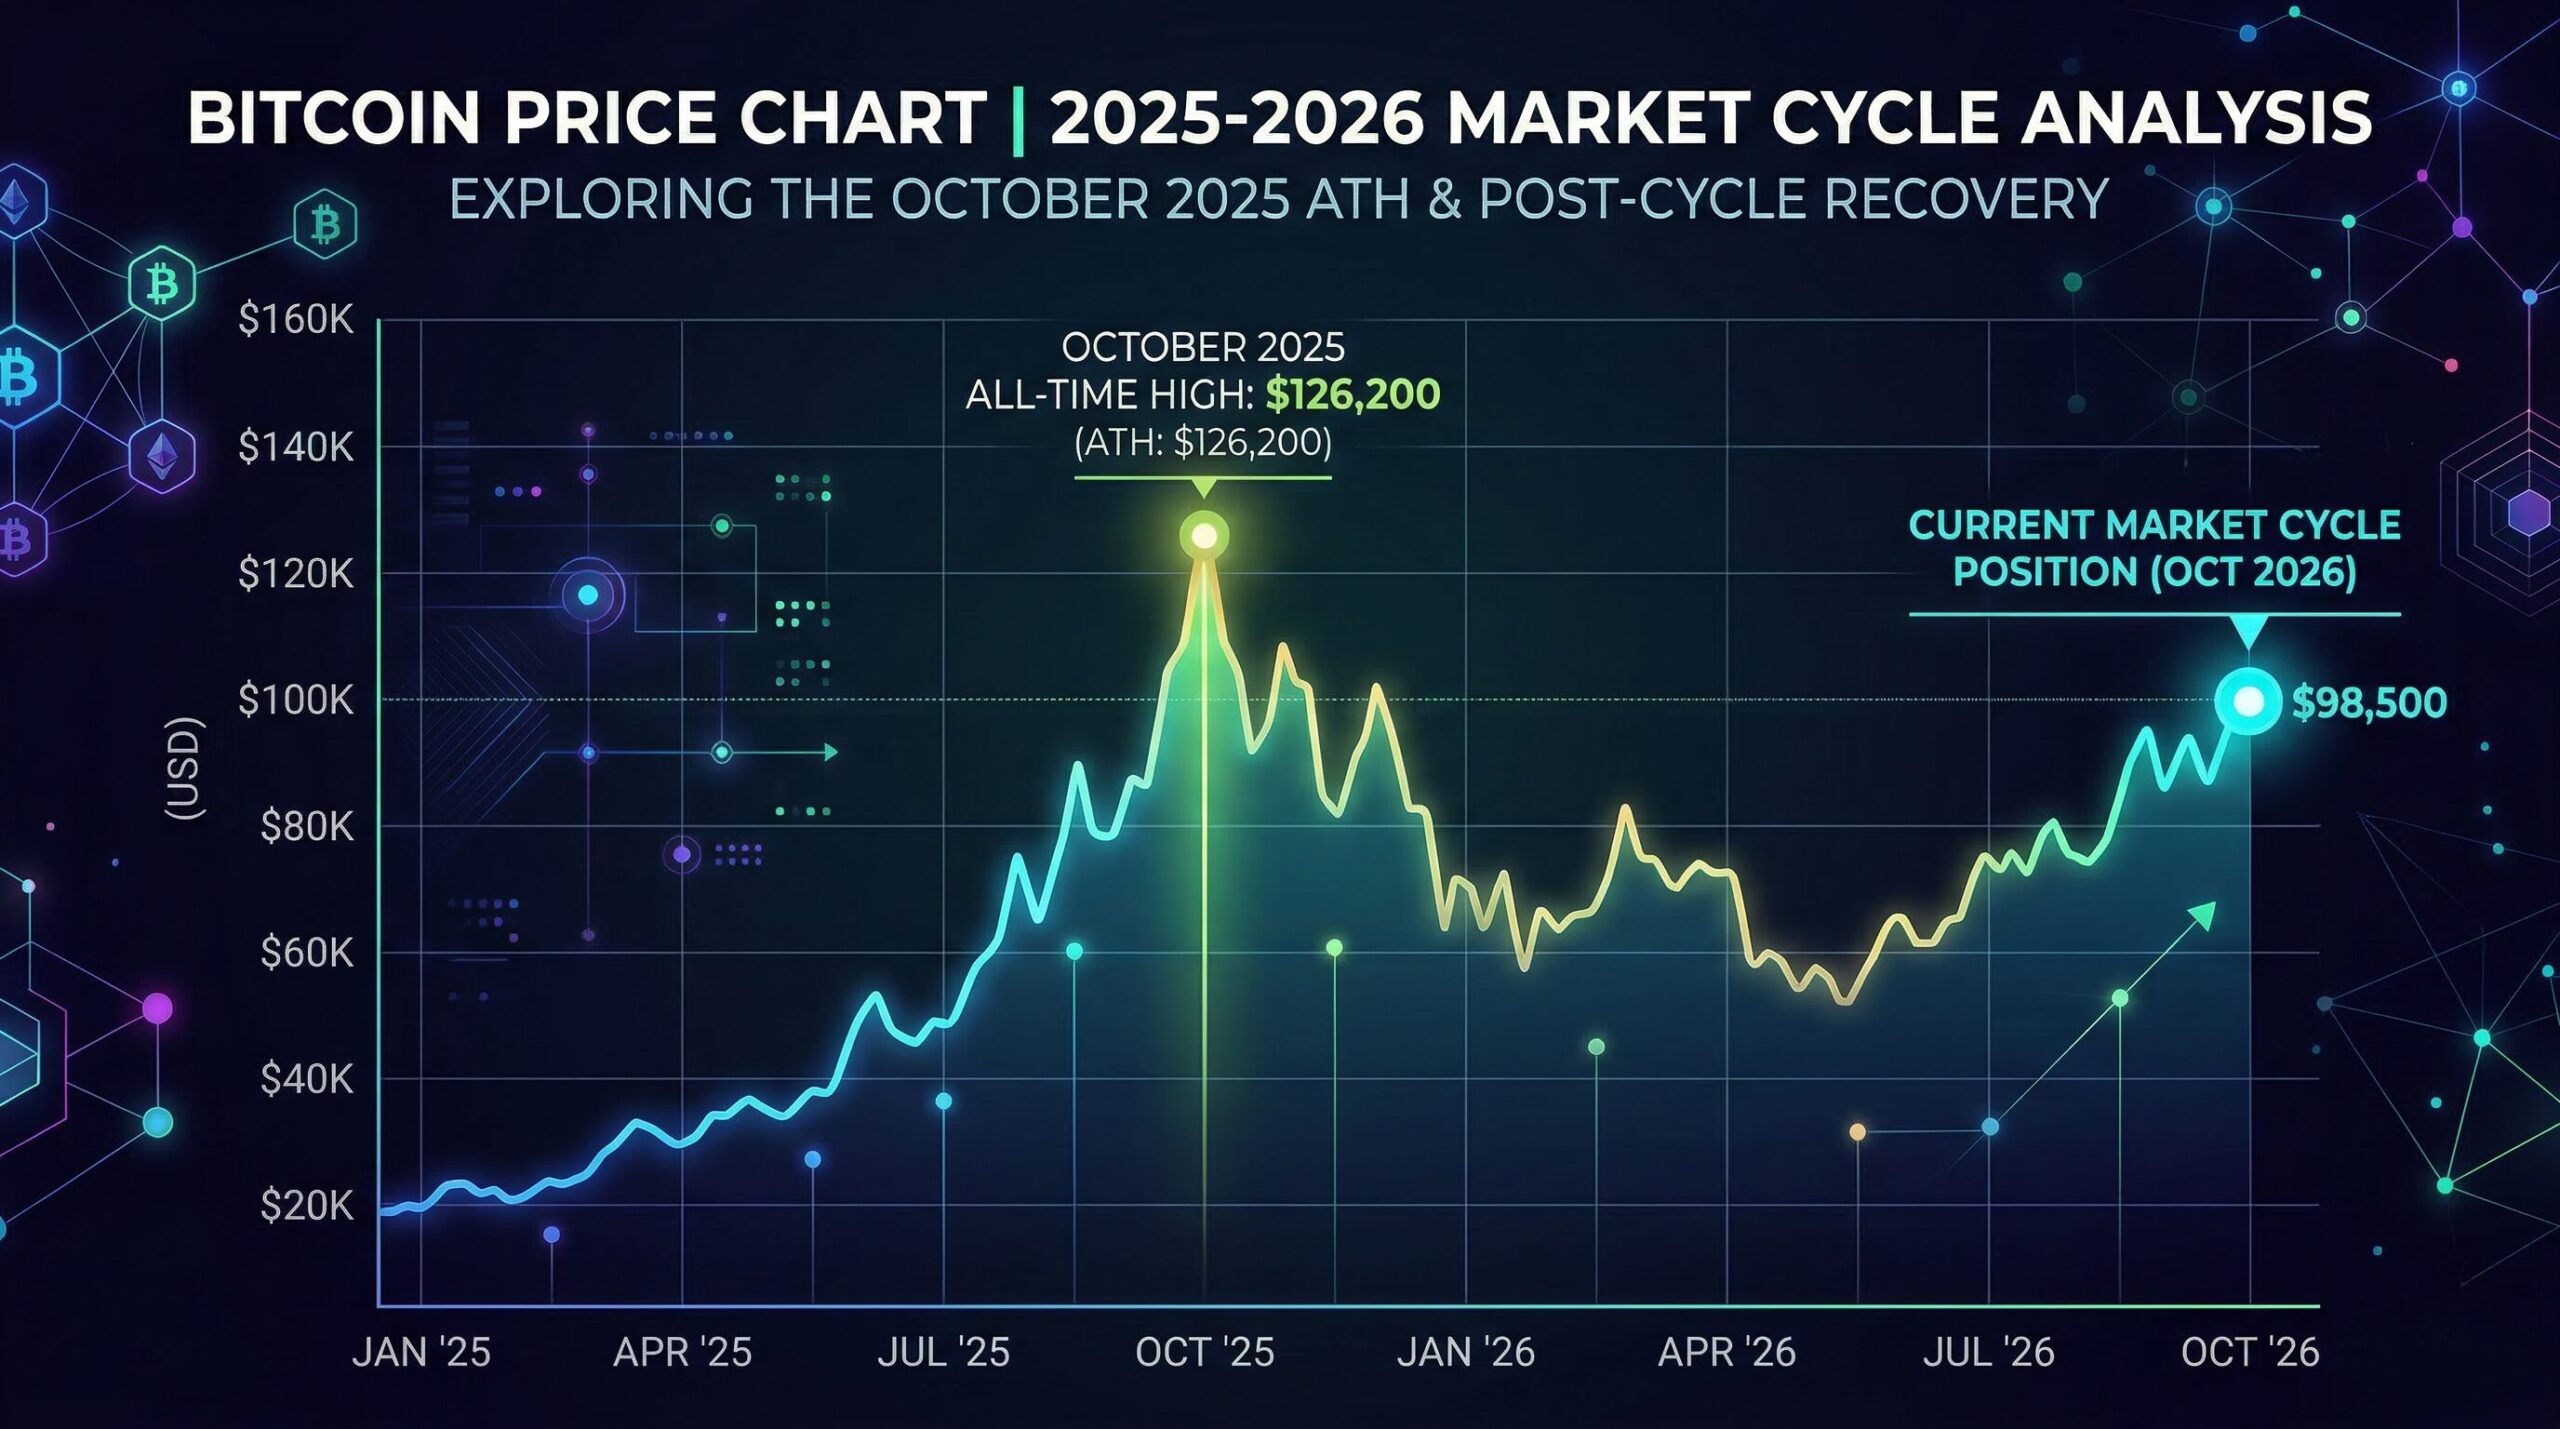
The fourth cycle is the one currently playing out. The bear market lows occurred in November 2022 at $15,500. The fourth halving took place on April 19, 2024, reducing block rewards from 6.25 to 3.125 BTC. The bull run reached an all-time high of approximately $126,200 on October 6, 2025 — establishing a new record and broadly following the four-year cycle timing predicted by analysts.
Since that October 2025 peak, Bitcoin has entered a significant correction. As of early 2026, Bitcoin has fallen approximately 46% from its all-time high, following a pattern consistent with prior bear market initiations. The question facing investors and analysts in 2026 is whether this decline represents a standard mid-cycle correction or the beginning of a full bear market.
Bitcoin Halvings: The Engine of the Cycle
The halving is the mechanism most directly linked to Bitcoin’s four-year cycle. Every 210,000 blocks (approximately four years), Bitcoin’s protocol automatically cuts the block reward — the amount of new BTC issued to miners per block — in half. This creates a predictable, decreasing supply schedule that is hardcoded into Bitcoin’s design.
How Halvings Affect Price
The basic economics are straightforward: if demand stays the same and supply decreases, price tends to rise. But the halving’s effect on Bitcoin’s price is more complex than simple supply/demand economics for several reasons:
1. Anticipation: Market participants anticipate halvings years in advance. Smart money tends to accumulate Bitcoin before the halving, already pricing in the supply reduction. This is why Bitcoin’s price often begins rising 12–18 months before each halving, not precisely at the halving date.
2. Miner behavior: Halvings immediately cut miner revenue in half. Miners who are unprofitable at lower prices are forced to sell their Bitcoin holdings to cover operating costs, which creates temporary selling pressure around each halving.
3. Narrative catalyst: Each halving generates substantial media coverage, introducing Bitcoin to new audiences and reinforcing the scarcity narrative to existing holders. This narrative effect is difficult to quantify but likely contributes to post-halving bull runs.
Historical Halving Data
| Halving | Date | Block Reward | Price at Halving | Next Cycle Peak | Peak Gain |
|---|---|---|---|---|---|
| 1st | Nov 2012 | 25 BTC | ~$12 | $1,150 (Nov 2013) | ~9,500% |
| 2nd | Jul 2016 | 12.5 BTC | ~$650 | $19,800 (Dec 2017) | ~2,900% |
| 3rd | May 2020 | 6.25 BTC | ~$8,700 | $69,000 (Nov 2021) | ~690% |
| 4th | Apr 2024 | 3.125 BTC | ~$64,000 | $126,200 (Oct 2025) | ~97% |
| 5th (projected) | ~Apr 2028 | 1.5625 BTC | TBD | TBD | — |
A clear trend is visible: each successive cycle peak shows a smaller percentage gain. This is expected as Bitcoin’s market capitalization grows. Moving from a $1 billion asset to a $10 billion asset requires less capital than moving from a $1 trillion asset to a $2 trillion asset. Returns are diminishing — but so are the drawdowns in percentage terms over time, as Bitcoin matures into a more established asset class.
What Drives Bitcoin Volatility?
Bitcoin’s price volatility is exceptionally high compared to traditional asset classes. Understanding why requires examining Bitcoin’s unique market structure.
Derivatives Markets and Leverage
One of the primary amplifiers of Bitcoin volatility is the derivatives market. By 2025–2026, the daily volume of Bitcoin perpetual futures on exchanges like Binance was nearly nine times higher than spot market volume. Perpetual futures allow traders to use significant leverage — often 10x, 20x, or more — to amplify their exposure.
When prices move against leveraged positions, exchanges automatically liquidate them. A 5% price move can trigger billions in liquidations, which themselves drive further price movement in the same direction, triggering more liquidations — a cascade effect that amplifies both upward and downward moves far beyond what fundamental news would warrant.
S&P Global’s 2026 analysis specifically highlighted the October 10, 2025 flash crash as an example: Bitcoin fell 8% in approximately 20 minutes as a liquidity crunch combined with high leverage triggered cascading liquidations. The event was mechanical, not fundamentally driven.
24/7 Market Structure
Unlike stock markets that close at the end of each trading day, Bitcoin trades 24 hours a day, 7 days a week, 365 days a year. This means price-moving news can hit during low-liquidity periods — late nights or weekends — when fewer traders are active and order books are thin. The same shock that would cause a 2% move during normal market hours can cause a 10–15% move when liquidity is sparse.
Macroeconomic Sensitivity
Bitcoin’s correlation to macro factors has increased as institutional participation has grown. The asset shows consistent negative correlation to the VIX (volatility index) and the US Dollar Index — rising when market confidence is high and the dollar is weak, falling when fear rises and the dollar strengthens. Tariff announcements, Federal Reserve policy decisions, and geopolitical events now regularly move Bitcoin’s price.
In early 2026, Bitcoin’s correction has been substantially driven by macroeconomic headwinds: US tariff policies, uncertainty around Federal Reserve leadership (with Kevin Warsh nominated as Fed Chair), and global growth concerns.
Bitcoin’s Long-Term Volatility Trend
Despite being highly volatile relative to traditional assets, Bitcoin’s volatility is measurably declining over time. Each successive cycle has seen lower peak volatility than the previous one. This is consistent with the asset maturing: a larger market cap means more capital is required to move the price, more institutional participants smooth out extreme moves, and more liquid derivatives markets provide better price discovery.
The long-term trend is toward lower but still elevated volatility — Bitcoin becoming more like a high-beta equity and less like a speculative small-cap asset. This process, however, is measured in years and decades, not months.
Where Is the Cycle in March 2026?
As of March 2026, the weight of evidence suggests Bitcoin has moved from the fourth cycle’s bull market into a bear market or significant correction phase:
- Bitcoin reached its all-time high of ~$126,200 on October 6, 2025
- Since that peak, Bitcoin has declined approximately 46% to around $67,000–$68,000
- This drawdown is consistent with mid-cycle corrections seen in previous cycles, though the magnitude is approaching bear market territory
- Bitcoin hit a 2026 low of approximately $81,000 in late January 2026, with further declines in Q1 2026
- The February 2026 low aligns with historical patterns where Bitcoin finds a mid-bear market low in February before an initial relief rally
Analysts and on-chain metrics present a range of views on what comes next. Caleb & Brown’s cycle analysis notes that if the four-year cycle holds, the current decline is consistent with standard post-halving-year corrections. Fidelity’s cycle research as of February 2026 observes that price action since October 2025 is more consistent with past bear markets than bull market corrections.
Significant remaining uncertainty exists. Some analysts forecast a deeper decline to $60,000 or below. Others point to structural differences in 2026 — spot Bitcoin ETFs with billions in inflows, corporate treasury holdings, and a more crypto-friendly US regulatory environment — as factors that may prevent the depth of corrections seen in previous cycles.
Do Bitcoin Market Cycles Still Apply in 2026?
A legitimate question as Bitcoin matures is whether the four-year cycle remains a reliable framework or will eventually break down. Several arguments exist on both sides.
Arguments That Cycles Will Continue
The halving mechanism is permanent: As long as Bitcoin’s code remains unchanged, halvings will continue every four years until the final Bitcoin is mined (around 2140). Each halving reduces supply growth, which creates a structural incentive for price appreciation if demand is maintained.
Human psychology is persistent: Boom-bust cycles in financial markets are not unique to Bitcoin. They reflect human emotions — fear and greed — that have driven market bubbles and crashes for centuries. As long as Bitcoin retains speculative participants alongside long-term holders, emotional cycles will produce boom-bust patterns.
Historical consistency: Four consecutive cycles following the same basic pattern is a meaningful data set, even if small. The pattern has persisted through dramatically different macro environments, regulatory contexts, and participant compositions.
Arguments That Cycles May Evolve
Institutional dampening: As institutional investors with longer time horizons, sophisticated risk management, and higher capital requirements participate more, the extreme volatility of past cycles may dampen. Institutional participants are less likely to panic-sell in bear markets or chase all-time highs in bull markets.
Bitcoin ETF impact: The 2024 launch of spot Bitcoin ETFs in the US created a new category of passive, accumulation-based Bitcoin demand. ETF inflows are relatively steady compared to retail speculation, which could reduce the amplitude of bull market peaks and bear market troughs.
Regulatory integration: As Bitcoin becomes more integrated into traditional finance — through ETFs, corporate treasuries, and eventually potential central bank holdings — it may trade more like a macro asset and less like a speculative commodity, potentially muting cycle extremes.
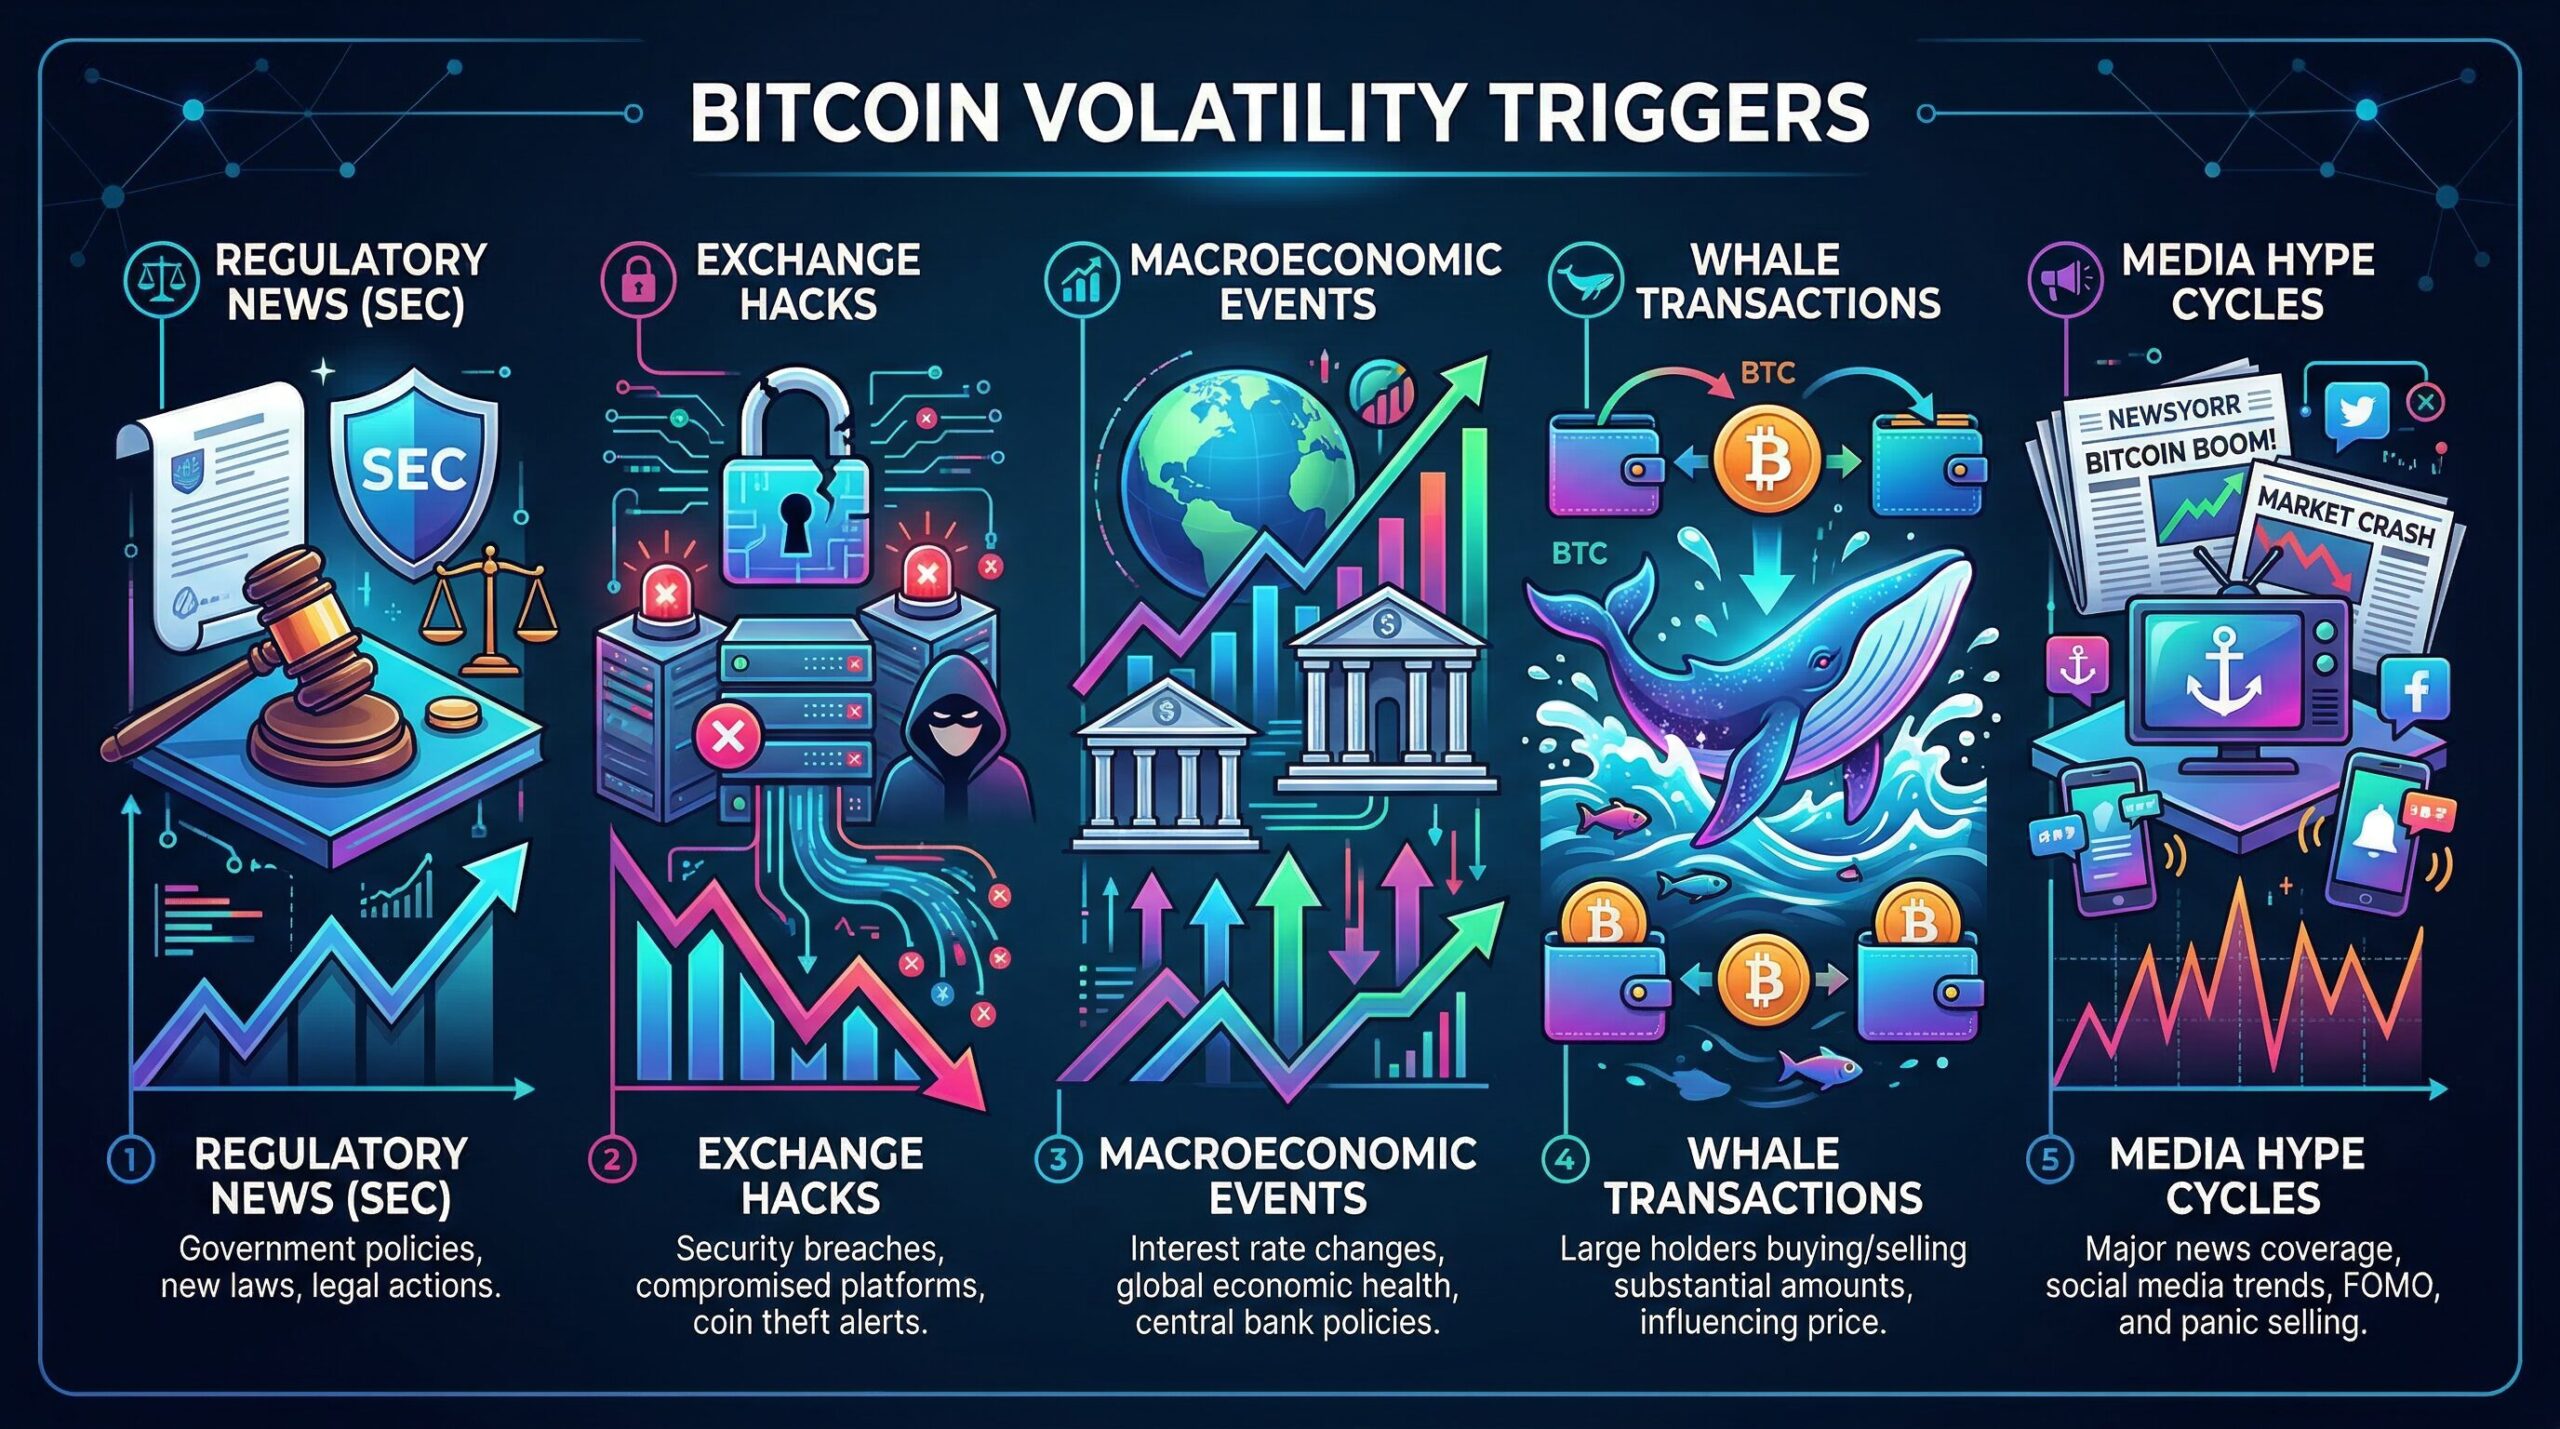
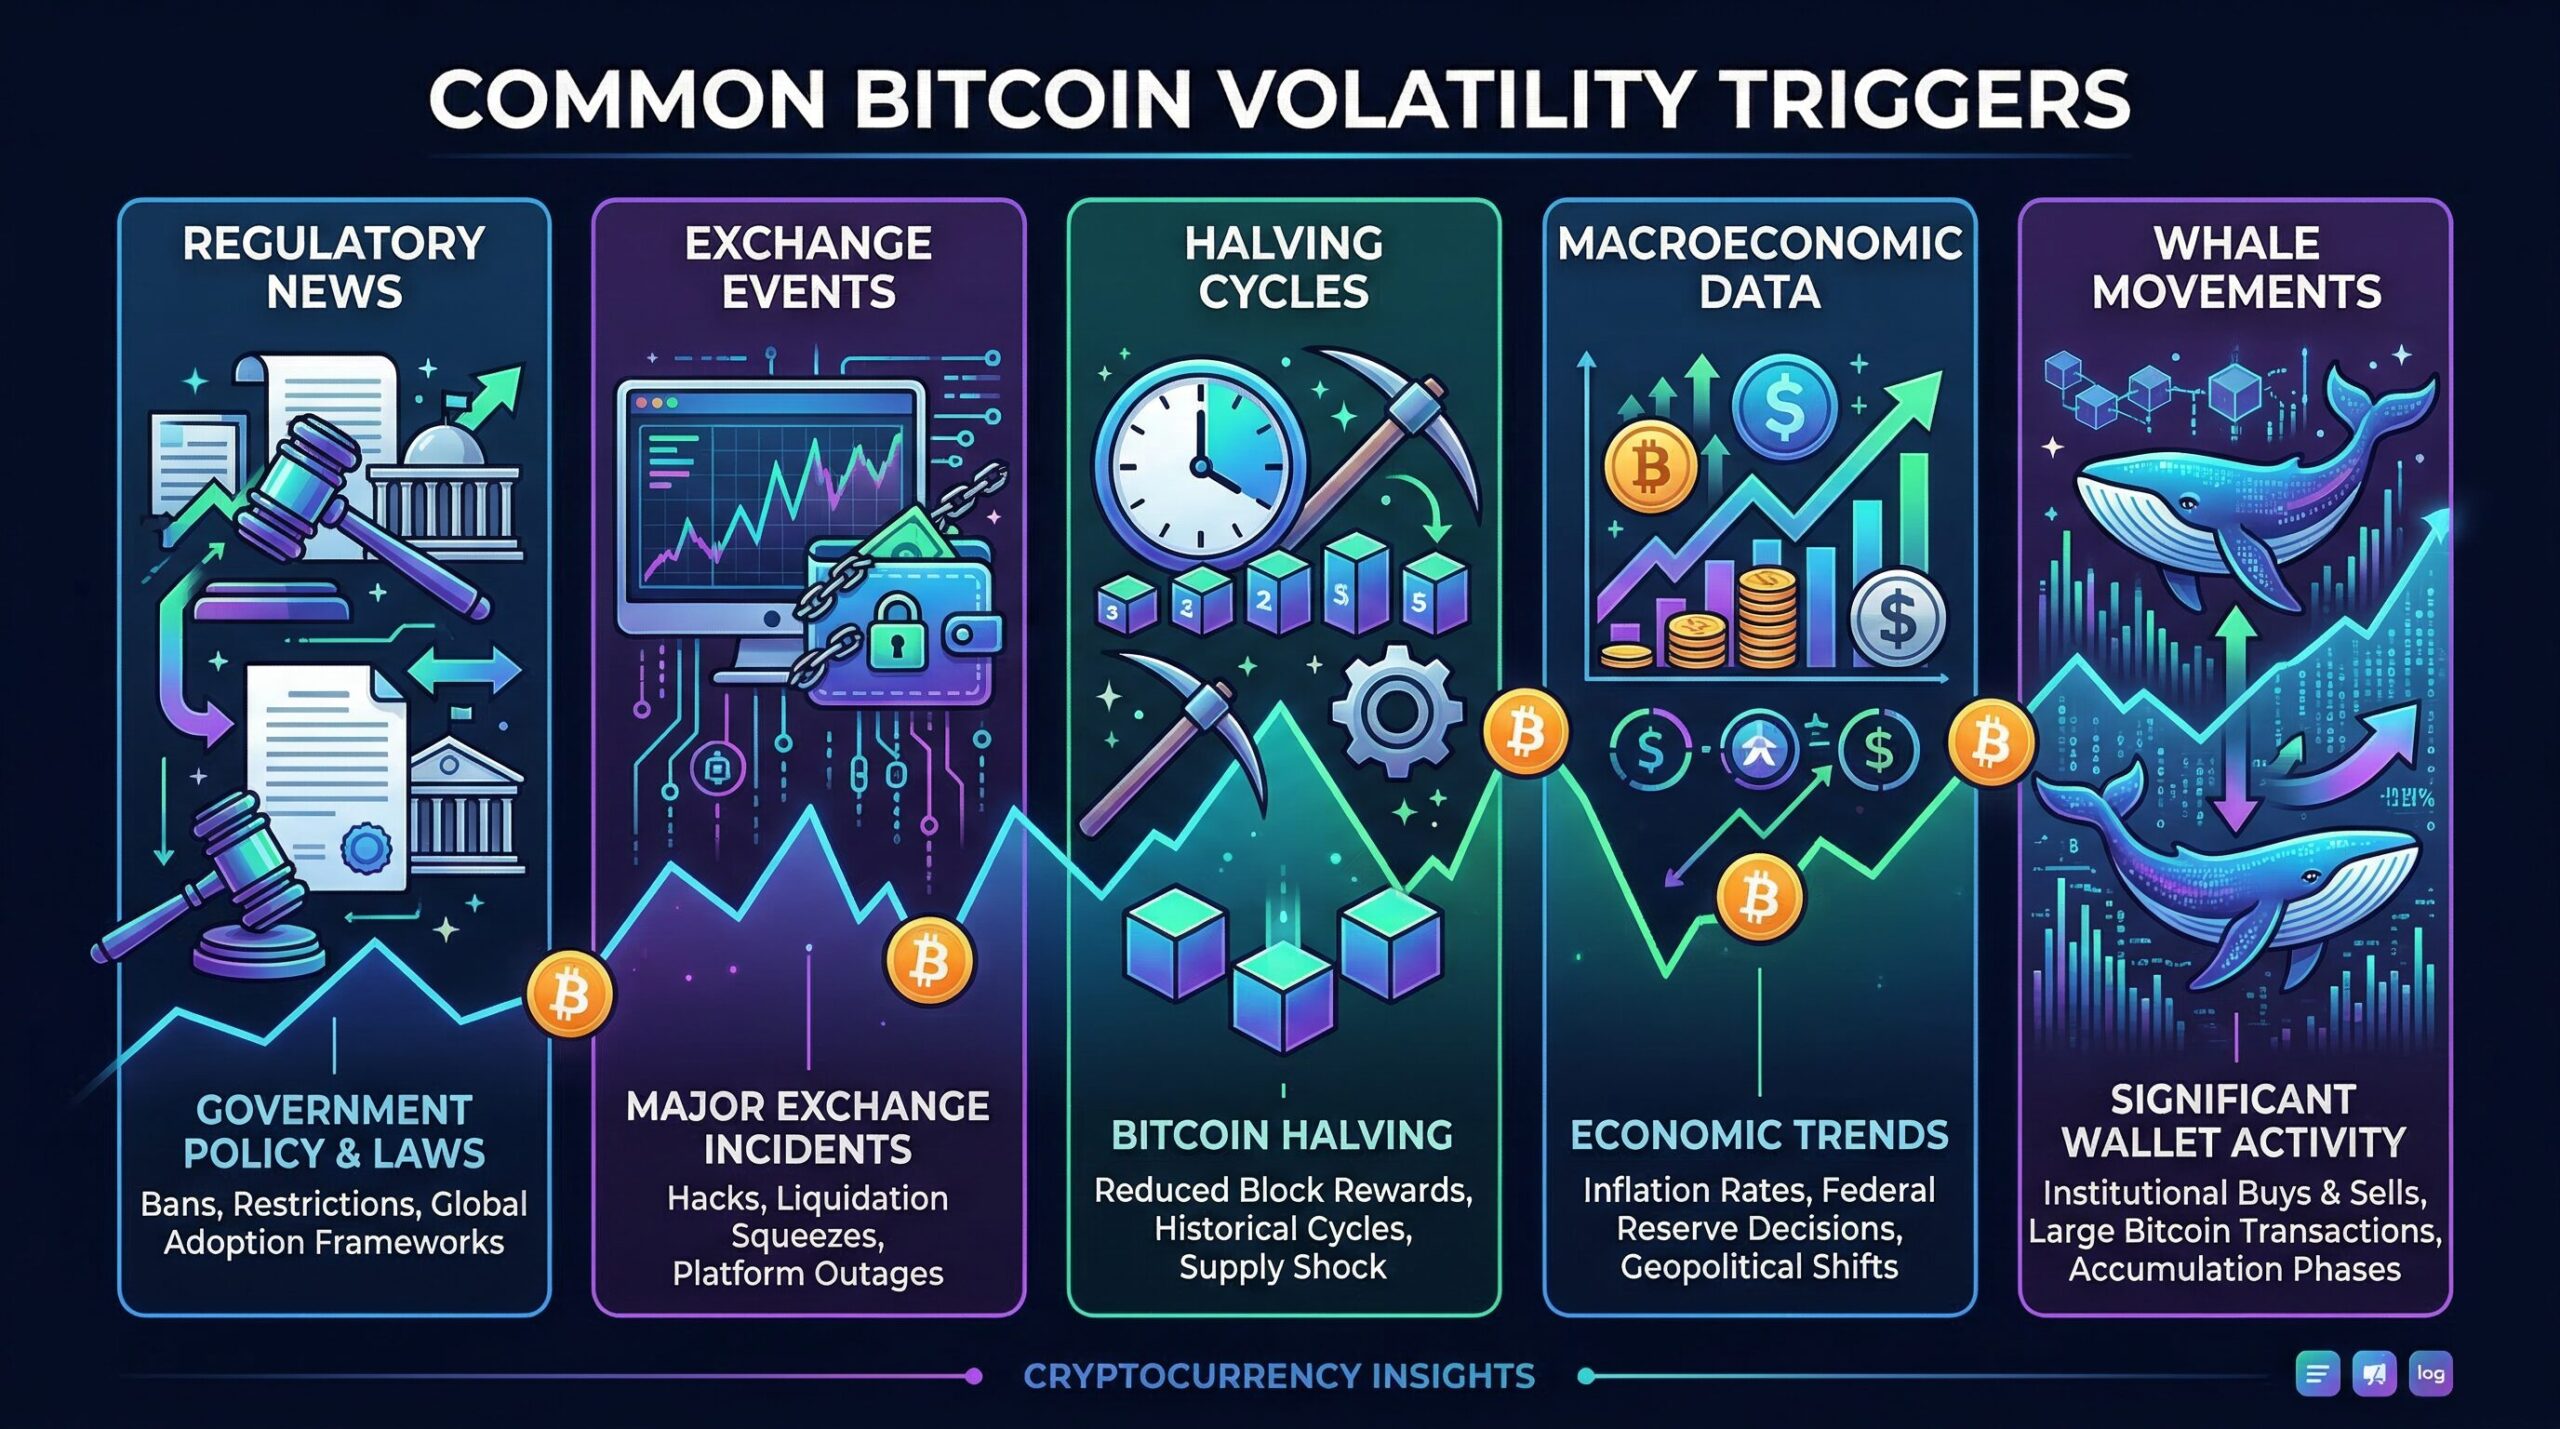
Common Bitcoin Volatility Triggers to Understand
Beyond the four-year cycle, Bitcoin experiences shorter-term volatility driven by specific event types. Understanding these helps investors separate noise from meaningful signals:
Regulatory News
Government actions regarding Bitcoin — approvals, bans, new legislation — reliably move markets. The 2024 SEC approval of spot Bitcoin ETFs in the US drove a significant price rally. Country-level bans (like China’s 2021 mining ban) have caused temporary but substantial crashes. Regulatory news is often misinterpreted in the short term — both overreacting to negative news and underreacting to positive developments.
Exchange and Custody Events
The collapse of FTX in November 2022 is the most dramatic example: the sudden insolvency of a major exchange wiped out approximately $8 billion in customer funds and drove Bitcoin from $20,000 to $15,500 within days. Exchange hacks, withdrawal freezes, and solvency rumors all create immediate selling pressure. The lesson: exchange custody carries custodial risk, and on-chain self-custody remains the only way to fully control your Bitcoin.
Macro Liquidity Events
Federal Reserve interest rate decisions, significant changes in the money supply, and major shifts in risk asset sentiment all impact Bitcoin. The 2022 bear market coincided directly with the Fed’s most aggressive rate-hiking cycle in decades. Conversely, the 2020–2021 bull run coincided with near-zero interest rates and massive monetary stimulus. Bitcoin increasingly behaves as a high-beta risk asset in response to macro liquidity conditions.
Large Wallet Movements (Whale Activity)
Bitcoin’s blockchain is fully transparent: every transaction is publicly visible. When large wallets (commonly called “whales”) — addresses holding thousands of Bitcoin — move funds to exchanges, it typically signals impending selling pressure. On-chain analytics platforms like Glassnode track these movements and provide data that market participants use to anticipate price movements.
Practical Implications for Long-Term Bitcoin Holders
Understanding Bitcoin’s market cycle framework has practical implications for how investors approach the asset. Note that nothing in this section constitutes investment advice; it is a descriptive analysis of common strategies:
Dollar-Cost Averaging (DCA)
Dollar-cost averaging — purchasing a fixed dollar amount of Bitcoin at regular intervals regardless of price — is one of the most common long-term strategies for Bitcoin accumulation. By buying consistently through all phases of the cycle, DCA investors automatically purchase more Bitcoin when prices are low and less when prices are high, averaging out their entry price over time and removing the psychological difficulty of trying to “time” the market.
Cycle Awareness Without Timing
Risk Sizing
Given Bitcoin’s volatility — historical drawdowns of 77–85% from peak — position sizing relative to overall portfolio is crucial. A 50% decline in a 5% Bitcoin allocation reduces total portfolio value by 2.5%. A 50% decline in a 50% Bitcoin allocation reduces total portfolio value by 25%. Bitcoin’s risk profile is distinct from equities, bonds, or real estate, and portfolio allocation should reflect this.
Frequently Asked Questions About Bitcoin Market Cycles
Has the four-year Bitcoin cycle ever failed?
In four cycles of data, the basic pattern of halving-preceding bull market, followed by significant correction, has held. However, the timing and magnitude have varied: the 2013 cycle had two distinct peaks, and the 2021 cycle saw an earlier mini-peak in April before the final November high. The pattern is a tendency, not a rule.
When will the next Bitcoin bull market begin?
Accurately timing market bottoms and the start of the next bull cycle is not possible with reliability. Historical patterns suggest bear markets last approximately 12–18 months from peak, pointing to a potential bottoming period in late 2026 to early 2027, aligning with the 2026 US midterm election year historical pattern. However, structural factors in 2026 — institutional holdings, ETF inflows, and macro conditions — may alter the timeline in either direction.
Is Bitcoin’s volatility decreasing?
Yes, measurably. Bitcoin’s realized volatility is on a long-term downward trend as its market capitalization grows and institutional participation increases. However, Bitcoin remains far more volatile than traditional asset classes. The reduction is from “extremely volatile” toward “very volatile” — a meaningful shift, but not a transformation into a stable asset.
What was Bitcoin’s all-time high?
Bitcoin’s all-time high price was approximately $126,200, reached on October 6, 2025. As of March 2026, Bitcoin trades significantly below that level following the post-peak correction.
How does Bitcoin’s market cycle compare to altcoins?
Altcoin market cycles are closely correlated with Bitcoin’s but typically feature amplified moves in both directions. When Bitcoin enters a bull market, altcoins often outperform it in percentage terms. When Bitcoin enters a bear market, altcoins typically fall further in percentage terms. This pattern has been consistent across multiple cycles, with altcoin market cap (“altseason”) historically lagging Bitcoin’s bull run by several months.
Conclusion: Understanding the Cycle Is Not a Crystal Ball
Bitcoin’s four-year market cycle is one of the most robust patterns in financial markets — four consecutive cycles with broadly consistent structure over 15 years of data. The halving mechanism creates a predictable supply reduction, human psychology drives the boom-bust dynamics, and the historical record provides a framework for contextualizing price movements.
As of March 2026, Bitcoin is navigating the post-peak phase of its fourth cycle, with the correction from the October 2025 high significant but still within historical ranges. Whether this resolves into a shorter consolidation or a deeper bear market similar to 2018 and 2022 depends on macroeconomic factors, regulatory developments, and institutional behavior that are inherently uncertain.
The market cycle framework is most useful not as a prediction tool but as a context provider — helping investors understand whether a given price move is likely noise or signal, whether sentiment is stretched in one direction, and where the current moment sits within a longer arc of Bitcoin’s development. Combined with sound risk management, this understanding helps navigate one of the most volatile asset classes in financial history with greater clarity.
This article is for educational purposes only and does not constitute investment advice. Cryptocurrency investments carry significant risk, including the possibility of total loss. Always conduct your own research and consult a qualified financial professional before making investment decisions.