
In my view, viral charts confuse things; real Bitcoin data suggests a complex few weeks ahead.#Bitcoin #onchain
Quick Video Breakdown: This Blog Article
This video clearly explains this blog article.
Even if you don’t have time to read the text, you can quickly grasp the key points through this video. Please check it out!
If you find this video helpful, please follow the YouTube channel “BlockChainBulletin,” which delivers daily Crypto news.
https://www.youtube.com/@BlockChainBulletins
Read this article in your native language (10+ supported) 👉
[Read in your language]
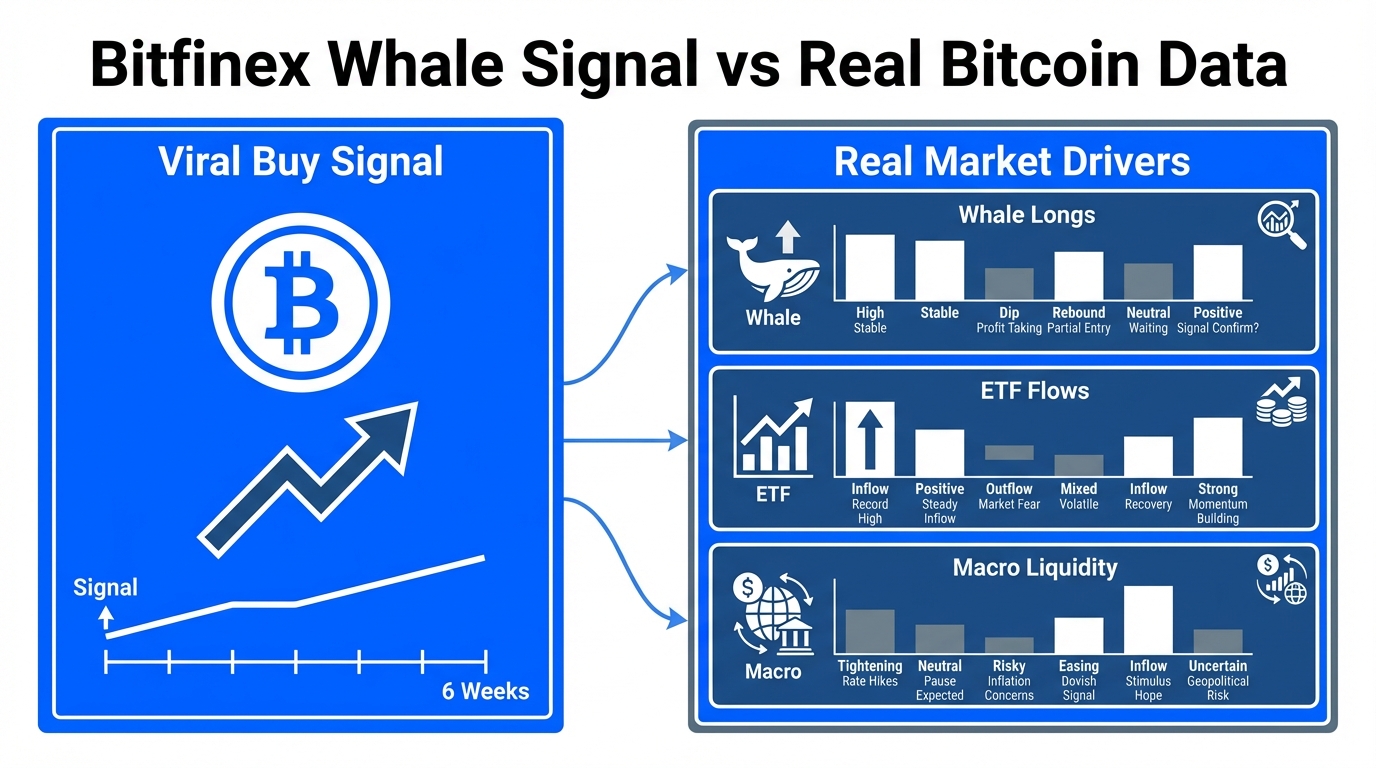
This Bitfinex whale “buy signal” is everywhere, but the real Bitcoin data suggests a much messier six weeks
Jon: Hey Lila, I came across this viral story on CryptoSlate about a so-called Bitfinex whale “buy signal” that’s popping up all over social media and crypto forums. It’s based on patterns from large Bitcoin holders on the Bitfinex exchange reducing their long positions, which some interpret as a prelude to a big rally. But the article warns that the real data points to a bumpier ride over the next six weeks, factoring in things like ETF inflows and leverage dynamics. Thought it’d be a good topic to unpack objectively—after all, understanding these signals can help demystify market movements without falling into hype traps.
Lila: Interesting, Jon. I’ve seen those charts floating around too, with people claiming it’s a surefire sign Bitcoin’s about to surge. Why does this matter, though? Isn’t it just another crypto rumor?
Jon: It matters because it highlights how market signals can be misleading if you don’t look deeper. Historically, when Bitfinex whales—those big players with massive holdings—start closing long positions after peaking, it’s sometimes preceded rallies. For instance, data from TradingView shows longs hit a high of 73,000 BTC recently and are now dropping, echoing patterns from 2024 and 2025 that led to price jumps. But the article points out the “messier” part: massive ETF variables are at play, with leverage potentially leading to volatility. Bitcoin’s hovering below $90K now, and some targets like $135K are floating around, but ignoring the noise could expose you to risks. It’s a reminder to focus on data over virality.
Lila: Got it—that makes sense as a cautionary tale. So, what’s the core problem here that this signal is trying to address?
Jon: The problem boils down to information asymmetry in crypto markets. Retail traders often chase viral signals without understanding the underlying mechanics, leading to herd behavior and potential losses. In this case, the Bitfinex whale signal is based on observable data from exchange order books and position tracking, but it’s oversimplified. Whales might be rotating positions for reasons unrelated to a bull run—like hedging against ETF-driven sell-offs or adjusting to macroeconomic shifts. The article suggests that while the signal has worked before, current conditions with high leverage and ETF inflows could make the next six weeks “messy,” with possible dips or sideways action before any sustained move.
Lila: Information asymmetry sounds technical. Can you break it down with an analogy?
Jon: Sure, think of it like traffic on a busy highway. The viral signal is like seeing a bunch of big trucks (whales) slowing down or exiting, which might make you think the road ahead is clear for a speed-up. But if you don’t check for construction (ETFs influencing flows), accidents (leverage wipes), or weather (macro events), you could end up in a jam. The real data—things like on-chain metrics, funding rates, and whale tracking—gives the full map, showing that the path might be messier than it appears.
Lila: That analogy clicks. It’s not just about spotting the trucks but understanding why they’re moving.
Jon: Exactly. Markets aren’t linear; they’re influenced by layers of factors. This is where digging into how these signals actually form becomes key.
Under the Hood: How it Works
Jon: Alright, let’s get into the mechanics. At its core, the Bitfinex whale buy signal comes from monitoring leveraged long positions on the exchange. Bitfinex is popular among big players because of its high-leverage options and liquidity. When whales accumulate longs—betting on price increases—and then suddenly reduce them after a peak, it can signal they’re taking profits or repositioning, often before a broader market uptick. This is tracked via public data APIs and platforms like TradingView or Santiment. But as the article notes, the “real Bitcoin data” includes ETF netflows, which have been massive variables since 2024, potentially overriding these signals with forced liquidations or inflows.
Lila: So, it’s like peering into the exchange’s order book? How does that tie into on-chain stuff?
Jon: Precisely. On-chain data, from blockchain explorers, shows actual wallet movements—whales transferring BTC to or from exchanges. Combine that with exchange-specific metrics like open interest (total outstanding contracts) and funding rates (fees for holding positions), and you get a fuller picture. For example, if longs peak at 73,000 BTC and drop aggressively, it might indicate whales are “rotating” into spot holdings, a bullish sign in past cycles. But with ETFs now holding billions in BTC, their buying or selling can swamp these signals, leading to that “messier” outlook.
Lila: Okay, that sounds layered. Maybe a comparison would help clarify the viral signal versus the real data approach.
Jon: Good idea. Let’s lay it out in a table to contrast them.
| Aspect | Viral Bitfinex Whale Signal | Real Bitcoin Data Approach |
|---|---|---|
| Basis | Reduction in long positions on Bitfinex after peaks, based on historical patterns. | Holistic view including on-chain transfers, ETF flows, funding rates, and macro indicators. |
| Strengths | Simple, easy to spot; worked in past cycles like 2024 (surge to new highs). | More robust; accounts for variables like leverage, reducing false positives. |
| Weaknesses | Ignores external factors; can lead to hype-driven decisions. | Requires deeper analysis; more time-intensive but less prone to ‘messy’ surprises. |
| Example Outcome | Predicts “six-week rip” but overlooks ETF sell-offs, leading to volatility. | Suggests potential short squeezes but warns of messiness, like recent dips below $90K. |
Lila: This table really highlights the differences. The viral signal is like a quick glance, while the real data is a full audit.
Jon: Spot on. And remember, tools like Glassnode or CryptoQuant provide this data—whale accumulation trends, for instance, show sustained buying by institutions, but with bearish positioning rising, it could prime a short squeeze as noted in recent analyses.
Lila: So who actually uses this? I mean, beyond traders chasing trends?
Jon: Great question. On the developer side, blockchain analysts and data scientists use these signals to build predictive models or dashboards. For example, integrating whale tracking into DeFi apps for better risk assessment—think alerting users to potential volatility spikes based on position data. Users, like researchers or hobbyists, might monitor them via platforms like Santiment to understand market sentiment without direct involvement. Institutionally, funds use on-chain forensics to gauge liquidity risks, especially with Bitcoin’s role as a store of value. The technical benefit is clearer decision-making; it’s about observing patterns to learn market dynamics, not speculating.
Lila: That shifts the focus to education over excitement. Speaking of which, how can someone start exploring this safely?
Jon: Let’s break it into levels. Start with Level 1: Research and Observation. Dive into whitepapers on Bitcoin’s architecture—Satoshi’s original paper is a must-read for context on proof-of-work and on-chain transparency. Use explorers like Blockchair or Blockchain.com to track whale addresses; search for known Bitfinex hot wallets and observe transaction flows. Dashboards on Dune Analytics let you query custom datasets, like long position trends, without any cost.
Lila: Sounds beginner-friendly. What about hands-on stuff?
Jon: That’s Level 2: Testnet or Hands-on Learning. Bitcoin doesn’t have a traditional testnet for trading, but you can simulate with tools like Python libraries (e.g., CCXT for exchange data) to pull and analyze historical whale signals. Experiment on free platforms like TradingView—set up charts with indicators for open interest and funding rates. For a deeper dive, use open-source repos on GitHub to build a simple bot that alerts on position changes. Emphasize: this is for learning mechanics, not real trades. Risks remain minimal if you stick to observation—volatility is inherent, so treat it as educational experimentation.
Lila: Appreciate the no-pressure approach. It keeps things responsible.
Jon: Absolutely. To wrap up, this Bitfinex signal is worth watching as a piece of the puzzle, showing how whale behaviors can hint at market shifts, potentially leading to rallies like the projected Q1 2026 recovery some analysts mention. But limitations abound—the messy six weeks ahead underscore that no signal is foolproof, especially with ETFs and leverage in the mix.
Lila: True, and let’s not forget crypto’s volatility and uncertainty. Always approach with caution and continuous learning.
Jon: Well said. It’s about building knowledge, not chasing quick wins.
—
References
- This Bitfinex whale “buy signal” is everywhere, but the real Bitcoin data suggests a much messier six weeks
- Official Bitcoin Website
- TradingView – Market Data and Charts
- Glassnode – On-Chain Analytics
- CoinTelegraph – Crypto News
▼ AI tools to streamline research and content production (free tiers may be available)
Free AI search & fact-checking
👉 Genspark
Recommended use: Quickly verify key claims and track down primary sources before publishing
Ultra-fast slides & pitch decks (free trial may be available)
👉 Gamma
Recommended use: Turn your article outline into a clean slide deck for sharing and repurposing
Auto-convert trending articles into short-form videos (free trial may be available)
👉 Revid.ai
Recommended use: Generate short-video scripts and visuals from your headline/section structure
Faceless explainer video generation (free creation may be available)
👉 Nolang
Recommended use: Create narrated explainer videos from bullet points or simple diagrams
Full task automation (start from a free plan)
👉 Make.com
Recommended use: Automate your workflow from publishing → social posting → logging → next-task creation
※Links may include affiliate tracking, and free tiers/features can change; please check each official site for the latest details.