
Why is Bitcoin stuck below $93K? Discover how a massive “underwater” supply wall pins its price despite breakout signals from on-chain data.#Bitcoin #OnChain #CryptoPrice
Quick Video Breakdown: This Blog Article
This video clearly explains this blog article.
Even if you don’t have time to read the text, you can quickly grasp the key points through this video. Please check it out!
If you find this video helpful, please follow the YouTube channel “BlockChainBulletin,” which delivers daily Crypto news.
https://www.youtube.com/@BlockChainBulletins
Read this article in your native language (10+ supported) 👉
[Read in your language]
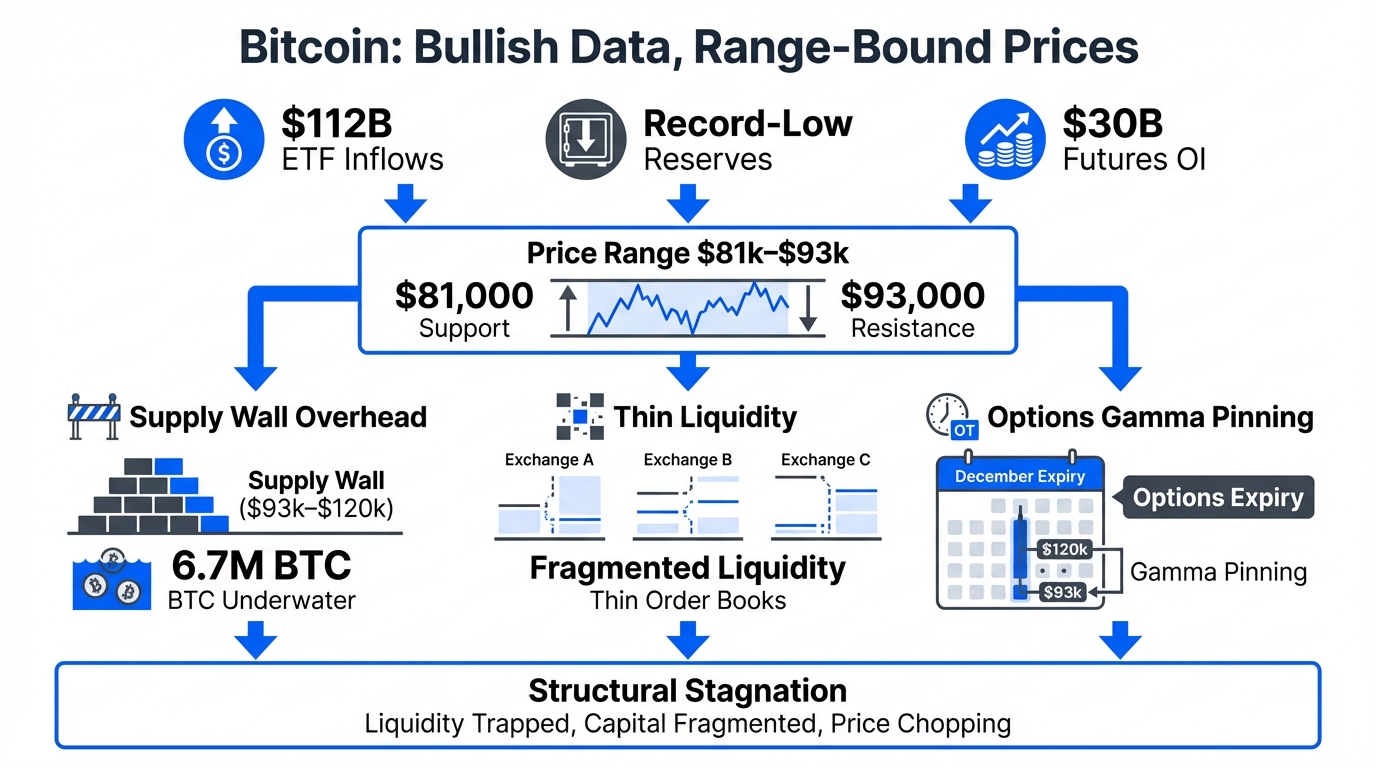
Bitcoin metrics signal a breakout, but a massive “underwater” supply wall is secretly pinning prices below $93,000
Jon: Hey Lila, I came across this intriguing piece from CryptoSlate about Bitcoin’s current market dynamics. The title pretty much sums it up: metrics are hinting at a potential breakout, but there’s this massive “underwater” supply wall that’s keeping prices stuck below $93,000. It’s based on on-chain data showing how spot depth has recovered, yet thin order books and weak inter-exchange flows are trapping BTC in a range that might last through Q1 2026.
Lila: Interesting, Jon. I’ve heard the term “underwater” tossed around in crypto, but I’m not totally clear on it. Sounds like something from diving or submarines. What’s the high-level scoop here?
Jon: Haha, not quite submarines, but close in a metaphorical sense. Essentially, “underwater” refers to Bitcoin holders who bought at prices higher than the current market value, so they’re sitting on unrealized losses. The article points out a huge cluster of these holders whose average purchase price creates a resistance level around $93,000. Metrics like realized price distributions and supply in loss suggest a breakout could be brewing, but this wall of potential sellers is pinning the price down, preventing a clean rally.
Lila: Why does this matter? Is it just another way the market is messing with our expectations, or is there something deeper for folks trying to understand Bitcoin’s behavior?
Jon: It matters because it highlights how on-chain data can reveal hidden pressures in the market that aren’t obvious from just looking at price charts. For anyone interested in crypto, grasping this helps explain why Bitcoin might consolidate for months despite bullish signals. It’s not hype; it’s about understanding supply dynamics that could influence price stability into 2026. Risks remain high, as always, with volatility being the name of the game.
Lila: Okay, that makes sense. But let’s dive into the problem itself. What’s the technical or structural issue here that’s creating this “wall”?
Jon: The core problem is overhead supply from holders who are “underwater” – meaning their coins were acquired at prices above the current spot, putting them in a loss position. When the price approaches their break-even point, many might sell to recoup costs, flooding the market with supply and capping upward movement. Glassnode data, as mentioned in related analyses, shows this dense supply between $81,000 and $93,000, exacerbated by options expiries and weak demand. It’s like a self-reinforcing barrier: bullish metrics build up steam, but the wall absorbs it.
Lila: Clarify that for me – how does this underwater supply actually act as a wall? Is it psychological, or is there more to it?
Jon: It’s a mix of psychology and economics. Think of it like a traffic jam on a highway. Imagine you’re driving (that’s the price trying to go up), and ahead is a massive toll booth where everyone who overpaid for gas earlier (underwater holders) is lining up to sell their extra fuel to break even. The more cars (supply) piling up at that booth, the harder it is for traffic to flow freely beyond it. In Bitcoin terms, on-chain metrics track these clusters via tools like UTXO realized price distribution, showing where supply is “stuck” and likely to be sold. This creates resistance, keeping prices range-bound even as other indicators, like recovering spot depth, signal potential breakouts. Without stronger demand to absorb that supply, we’re stuck in neutral, possibly through early 2026 as per the analysis.
Lila: That analogy clicks – it’s not just random; it’s built on real holder behavior. So, how does this all work under the hood? Break it down for us.
Under the Hood: How it Works
Jon: Alright, let’s get technical but keep it accessible. At its core, this underwater supply wall stems from Bitcoin’s on-chain mechanics. Bitcoin operates on a blockchain where every transaction output (UTXO) carries a history, including the price at which it was last moved. Analysts use metrics like the Realized Price, which is the average price at which all Bitcoins were last transacted, to map out where holders are profitable or in loss. Right now, a significant portion of supply is held by addresses that bought above $93,000, creating what’s called “overhead supply.” This acts as resistance because as price nears those levels, loss-holders may sell, increasing sell-side pressure.
Lila: So, it’s like the blockchain is a giant ledger remembering everyone’s buy-in prices? That sounds powerful for analysis.
Jon: Exactly. Tools like Glassnode and CryptoQuant aggregate this data into visualizations, showing “supply in loss” – the percentage of BTC underwater. For instance, recent data indicates about 60% of Bitcoin ETF holdings are underwater, hovering near an $80,000 breakeven, which adds to the distribution phase. Breakout signals come from things like improving technical setups or leverage flushes in derivatives, but the wall pins it. To compare this to past cycles, let’s look at a quick table.
| Metric | Current Cycle (2025) | Previous Cycle (2021) |
|---|---|---|
| Underwater Supply Wall Level | Around $93,000, with dense overhead from $81k-$93k | Near $60,000, post-halving resistance |
| Supply in Loss (%) | Approximately 60% for ETFs, overall high due to recent highs | Peaked at 50% during corrections |
| Breakout Signals | Recovering spot depth, but thin order books | Strong retail inflows led to quick breaks |
| Projected Duration | Range-bound through Q1 2026 | Resolved in months with bull run |
Lila: That table really highlights how this isn’t new, but the numbers are bigger now. Rephrasing: In today’s market, there’s more “stuck” supply at higher levels, making breakouts tougher?
Jon: Spot on. The mechanics involve tracking metrics like MVRV ratio (market value to realized value), which is flashing bearish signals per CryptoQuant, indicating possible cycle tops. Inter-exchange flows are collapsed, meaning less BTC moving between platforms, which thins liquidity and reinforces the wall. It’s all interconnected in Bitcoin’s decentralized ledger.
Lila: So who actually uses this? I mean, beyond traders staring at charts, what’s the real-world application of understanding these metrics?
Jon: Great question. On a developer level, blockchain analysts and protocol builders use these insights to refine tools like dashboards or predictive models. For example, integrating on-chain data into DeFi apps for better risk assessment. For users, it’s about informed decision-making – institutional investors monitor supply walls to time allocations, while educators use it to teach market cycles. Technically, it benefits anyone building on Bitcoin, like Layer-2 solutions, by anticipating liquidity conditions. The focus is on resilience; understanding this helps in creating more robust systems, not chasing quick gains.
Lila: Makes sense – it’s more about the ecosystem than individual wins. Now, if someone’s curious, what’s an educational action plan to learn more without jumping into risks?
Jon: Let’s break it into levels. For Level 1: Research and Observation. Start by reading whitepapers on on-chain analytics from sources like Glassnode or CryptoQuant. Use free dashboards to track metrics – for instance, explore Bitcoin’s UTXO age distribution on blockchain explorers like Blockstream.info. Observe how supply in profit/loss changes over time; it’s like watching traffic patterns without driving.
Lila: And for hands-on? How can someone try this safely?
Jon: Level 2: Testnet and Hands-on Learning. Bitcoin has a testnet where you can experiment with transactions without real value at stake. Set up a wallet like Electrum on testnet, simulate buys/sells, and use tools like Dune Analytics to query mock data. This lets you understand mechanics like realized prices in a sandbox. Remember, it’s for learning token flows and architecture – emphasize minimal-risk experimentation to grasp concepts like supply dynamics.
Lila: That’s practical. Wrapping up, what’s the big picture here?
Jon: In summary, these Bitcoin metrics offer a window into potential breakouts tempered by real supply barriers, like the underwater wall at $93,000. It’s an opportunity to appreciate the blockchain’s transparency, but limitations include external factors like miner selling or macro events that could prolong the range.
Lila: Absolutely, and remember, crypto is volatile and uncertain – always approach with caution and continuous learning.
Jon: Well said. Worth watching how this evolves, but stay grounded in the data.
About the Authors
Jon is a Web3 researcher and practitioner, focusing on analytical insights into blockchain mechanics.
Lila is a rational learner bridging complex topics for beginners.
References & Further Reading
- Bitcoin metrics signal a breakout, but a massive “underwater” supply wall is secretly pinning prices below $93,000
- Official Bitcoin Website
- Glassnode – On-Chain Analytics
- CryptoQuant – Market Insights
- Cointelegraph – Crypto News