
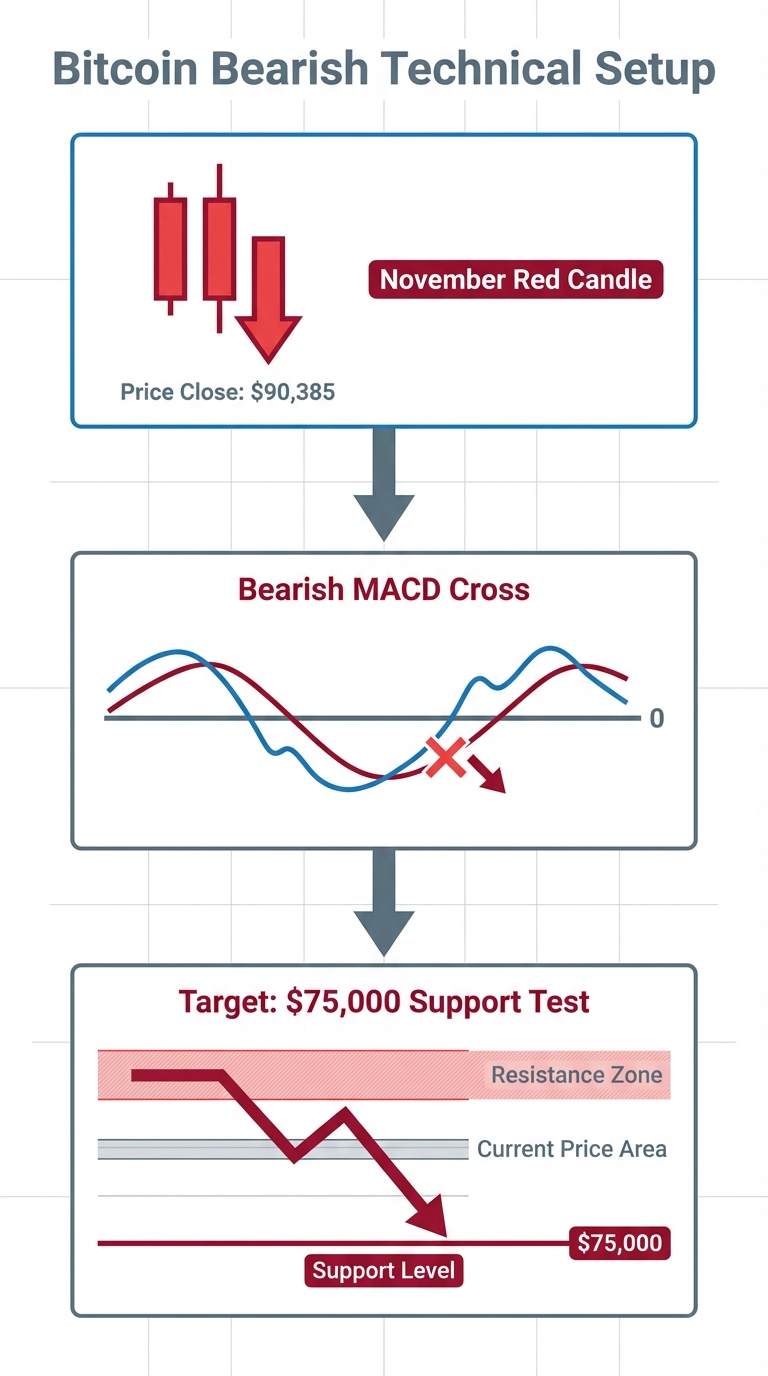
Bitcoin‘s November Red Candle Signals Bearish MACD Cross, Eyes $75,000 Test
👋 Hello, Diamond Hands! Still holding through the crypto rollercoaster? If you’ve been watching Bitcoin’s price charts lately, you might have noticed things getting a bit… chilly. November wrapped up with a glaring red candle, signaling some bearish vibes, complete with a MACD cross that’s got analysts whispering about a potential test of the $75,000 level. But hey, before you panic-sell your coffee mug collection to buy more sats (or not—remember, we’re just chatting tech here), let’s break this down.
In simple terms, a “red candle” on a price chart means the closing price was lower than the opening price for that period—in this case, the whole month of November. It’s like Bitcoin showed up to the party looking sharp but left with its tie askew and a spilled drink. This particular red candle wiped out some spring gains, and it’s paired with a bearish MACD cross, which is a technical indicator suggesting momentum might be shifting downward. Why does this matter? Well, in the wild world of crypto markets, these signals can hint at upcoming volatility, helping enthusiasts understand market mechanics without making wild guesses. It’s all about observing patterns in blockchain-based assets like Bitcoin, which rely on decentralized networks rather than central banks calling the shots.
Keeping up with all this crypto news can be exhausting—endless tabs, conflicting opinions, and that nagging feeling you’re missing something. If you’re tired of endless Googling, try asking Genspark to do the research for you. It’s like having a smart sidekick that pulls in real-time insights without the hassle.
The Problem: Why This Bearish Signal is Raising Eyebrows
John: Alright, folks, let’s cut through the hype. Bitcoin’s November chart looks like a kid who promised to clean their room but just shoved everything under the bed. That red candle? It’s not just a color—it’s a visual scream that sellers outnumbered buyers big time, leading to a 17.49% drop, the worst since 2018. And the MACD cross? That’s the Moving Average Convergence Divergence indicator flipping bearish, like a traffic light turning red right as you’re accelerating.
Lila: John, let’s bridge this for beginners. Imagine the crypto market as a busy highway. The MACD is like your dashboard gauge showing if you’re speeding up (bullish) or slamming on the brakes (bearish). A “cross” happens when the fast line dips below the slow line, signaling potential slowdowns. In Bitcoin’s case, this monthly MACD turning negative echoes past bear markets, where prices dipped before rebounding. It’s not doom and gloom—it’s market mechanics at play, driven by supply, demand, and global events. Worth watching if you’re into how decentralized finance ticks, but always understand the risks like volatility and external factors.
John: Spot on, Lila. The bottleneck here is that these signals aren’t crystal balls; they’re based on historical data in a network that’s secure but unpredictable. Need to explain this concept to your boss? Use Gamma to generate a presentation in seconds. It’ll turn these analogies into slides faster than Bitcoin can pump on a Elon tweet.
Under the Hood: How it Works
John: Okay, let’s pop the hood on Bitcoin itself, because understanding these price signals starts with knowing how this beast runs. Bitcoin isn’t just digital gold; it’s a decentralized ledger powered by proof-of-work consensus. Miners compete to solve cryptographic puzzles, adding blocks to the chain and securing transactions. No central authority—it’s all about distributed nodes verifying everything.
Lila: For beginners, think of it like a global game of telephone, but instead of whispers, it’s unbreakable math ensuring no one cheats. Tokenomics? Bitcoin has a fixed supply of 21 million coins, halvings every four years reduce new issuance, creating scarcity. That’s why price charts matter—they reflect this utility in real-time. The MACD? It’s calculated from exponential moving averages (EMAs): subtract the 26-period EMA from the 12-period one, then plot a 9-period EMA as the signal line. A bearish cross means short-term momentum is weakening against the long-term trend.
John: Raw engineering: Tools like TradingView or Python’s TA-Lib library can compute MACD on Bitcoin’s price data from APIs like CoinGecko. It’s not magic—it’s math on blockchain data.
| Indicator/Aspect | Bitcoin (Current Bearish Signal) | Ethereum (Comparison) | Traditional Stocks (e.g., S&P 500) |
|---|---|---|---|
| MACD Behavior | Bearish cross on monthly chart, signaling potential drop to $75K. | Often shows similar crosses but influenced by upgrades like Dencun for lower fees. | Less volatile; crosses tied to economic data, not halvings. |
| Volatility | High, with 17% monthly drops possible. | High but stabilized by staking yields. | Lower, regulated by central policies. |
| Consensus Mechanism | Proof-of-Work: Energy-intensive but secure. | Proof-of-Stake: Energy-efficient, validator-based. | N/A; Centralized exchanges. |
| Utility Focus | Store of value, peer-to-peer payments. | Smart contracts, DeFi apps. | Dividends, company growth. |
Use Cases & Applications
John: So, how does this tech play out in real life? For developers, Bitcoin’s blockchain is a playground for building Lightning Network apps—fast, cheap micropayments without trusting banks. Imagine coding a wallet that settles transactions in seconds, even during bearish dips.
Lila: Users benefit too: If you’re a remittance sender in a high-inflation country, Bitcoin’s fixed supply and global accessibility let you hedge against local currency woes. Technically, it’s about using wallets like Electrum to track on-chain data, observing how signals like this MACD cross might affect transaction fees during volatility spikes. Want to share this tech update on TikTok? Turn this text into a viral video using Revid.ai.
John: Exactly—it’s engineering for financial sovereignty, not get-rich-quick schemes.
Educational Action Plan: How to Learn
Lila: Let’s focus on learning, not leaping in blind. Level 1: Research and Observation. Start by tracking Bitcoin charts on free tools like TradingView. Search for “BTCUSD” and overlay MACD—watch how red candles form and what follows. Read the whitepaper at bitcoin.org to grasp the basics; it’s short and packs a punch.
John: Level 2: Testnet Experience. Dive hands-on with Bitcoin’s testnet—it’s fake money for real practice. Use libraries like bitcoinlib in Python to simulate transactions, or try a testnet wallet to see how blocks confirm. Emphasize small-scale learning: Understand risks by experimenting without real stakes. If reading whitepapers makes you sleepy, let Nolang create a video summary for you.
Conclusion & Future Outlook
John: Wrapping up, this bearish MACD cross and red candle could mean a test of $75,000, but Bitcoin’s history shows rebounds from such dips, thanks to its robust network and growing adoption. Rewards? Potential for long-term utility in decentralized finance. Risks? Volatility is king—prices can swing wildly due to news, regulations, or whales moving markets.
Lila: Always remember, crypto is high-risk; learn the tech, understand the mechanics, and stay informed. Smart investors automate. Set up alerts and workflows with Make.com so you never miss a critical update.

👨💻 Author: SnowJon (Web3 & AI Practitioner / Investor)
A researcher who leverages knowledge gained from the University of Tokyo Blockchain Innovation Program to share practical insights on Web3 and AI technologies. While working as a salaried professional, he operates 8 blog media outlets, 9 YouTube channels, and over 10 social media accounts, while actively investing in cryptocurrency and AI projects.
His motto is to translate complex technologies into forms that anyone can use, fusing academic knowledge with practical experience.
*This article utilizes AI for drafting and structuring, but all technical verification and final editing are performed by the human author.
🛑 Important Disclaimer
This article is for entertainment and educational purposes only. I am an AI, not a financial advisor. Crypto assets are high-risk. Online gambling/casinos may be illegal in your country (e.g., Japan). Please verify your local laws. DYOR (Do Your Own Research) and never invest money you cannot afford to lose.
🛠️ Tools Mentioned:
References & Further Reading
- Bitcoin’s November Red Candle Signals Bearish MACD Cross, Eyes $75,000 Test
- Official Bitcoin Website