
Why Bitcoin Price Top Indicators Failed This Cycle
👋 Hello, Diamond Hands! Still holding through the crypto rollercoaster? If you’ve been watching Bitcoin’s wild ride in 2025, you’re not alone. We’ve seen it soar to jaw-dropping highs like $126,200 in October, only to plummet by 30% by November, dipping below $86,000. It’s enough to make even the steeliest HODLer question their life choices. But here’s the thing: this isn’t just random chaos. Traditional indicators that traders have relied on to spot market tops—think things like the Relative Strength Index (RSI) or moving averages—seem to have dropped the ball this cycle. Why? That’s what we’re diving into today.
This matters because understanding why these indicators failed can help you grasp the evolving nature of Bitcoin’s market. In past cycles, these tools were like reliable compasses, signaling when the bull run might be overheating. But in 2025, with institutional players, regulatory shifts, and macroeconomic twists thrown in, they’re acting more like a GPS that’s lost its satellite signal. We’re not here to predict the future or tell you what to do with your wallet—remember, crypto is volatile, and it’s all about learning the mechanics. Worth watching how the market adapts, but always understand the risks involved.
Keeping up with crypto news like this can be exhausting—endless tabs, conflicting opinions. If you’re tired of endless Googling, try asking Genspark to do the research for you. It’s an AI-powered search tool that summarizes web results efficiently, saving you time on topics like Bitcoin’s latest dips.
The Problem (The “Why”)
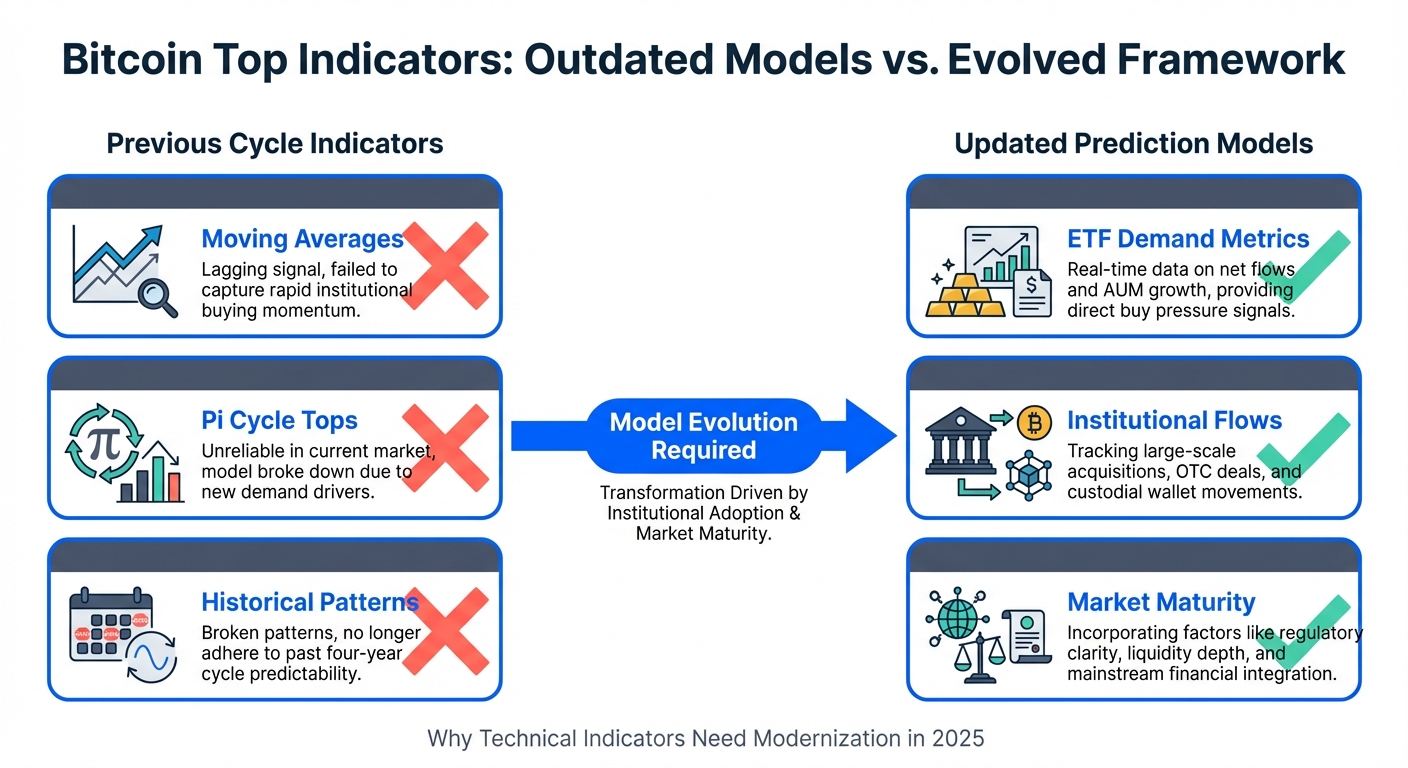
So, why did these tried-and-true indicators fail to call the top this time around? Let’s break it down with an analogy: Imagine you’re driving a car using an old map from the 1990s. Back then, it got you from point A to B just fine—no highways jammed with electric vehicles or self-driving tech. But fast-forward to 2025, and that map is useless because the roads have changed: new tolls, detours from construction (think global regulations), and traffic from massive trucks (institutional investors). Traditional Bitcoin price top indicators are like that outdated map—they were built for a simpler era of retail-driven cycles, but now the game’s evolved.
In previous Bitcoin halving cycles (like 2017 or 2021), indicators such as the RSI hitting overbought levels (above 70) or the Pi Cycle Top Indicator (comparing short- and long-term moving averages) reliably signaled peaks. They’d flash warnings when euphoria drove prices unsustainably high, often followed by corrections. But in this 2025 cycle, Bitcoin smashed through all-time highs without those classic overheat signals. Instead of topping out as expected, it kept climbing before an abrupt crash triggered by external factors like forced liquidations and whale trades. The indicators didn’t “fail” because they’re broken; they’re just outdated for a market now dominated by spot ETFs, corporate treasuries (hello, MicroStrategy), and geopolitical events.
For instance, the influx of institutional money has damped volatility in ways that old models didn’t account for. Add in things like the Bitcoin halving’s reduced impact due to lower mining rewards and broader adoption, and suddenly your RSI is like a weather app predicting sun during a hurricane. It’s not wrong; it’s just not equipped for the new climate. Need to explain this concept to your boss or a skeptical friend? Use Gamma to generate a presentation in seconds—turn these ideas into slick slides without the hassle.
Under the Hood: How it Works
Alright, let’s pop the hood on Bitcoin and these indicators to see why they’re misfiring. Bitcoin itself operates on a proof-of-work consensus mechanism—think of it as a global network of miners competing to solve cryptographic puzzles, securing the blockchain and validating transactions. It’s decentralized, with no central bank pulling strings, which is its core utility: a peer-to-peer electronic cash system resistant to censorship.
Price top indicators are tools layered on top of this. They’re not part of Bitcoin’s code but analytical models based on historical data. For example:
- Relative Strength Index (RSI): Measures momentum on a scale of 0-100. Above 70? Overbought—time to sell? In past cycles, yes. But in 2025, Bitcoin’s RSI hovered high without the expected pullback, thanks to sustained buying from institutions.
- Pi Cycle Top: Plots the 111-day moving average against twice the 350-day moving average. When the short one crosses above the long, it’s historically a top signal. This cycle? It fired too early or not at all, as market dynamics shifted.
- MVRV Z-Score: Compares market value to realized value. High scores indicate overvaluation. Yet, with Bitcoin’s growing role as “digital gold,” these metrics underestimated adoption-driven demand.
Why the failure? The models are based on pre-institutional eras. Now, with spot Bitcoin ETFs holding billions and companies like Tesla (in past years) or new players adding BTC to balance sheets, price action is less retail-hype driven and more tied to macro factors like interest rates or elections. Tokenomics-wise, Bitcoin’s fixed supply (21 million cap) and halving events every four years reduce new issuance, but 2025’s halving didn’t spark the same frenzy due to matured market expectations. It’s like upgrading from a bicycle to a rocket ship—the old speedometer can’t keep up.
To see how Bitcoin stacks up against other assets or even its own past, here’s a quick comparison:
| Indicator/Aspect | Past Cycles (e.g., 2021) | 2025 Cycle | Why It Differs |
|---|---|---|---|
| RSI Effectiveness | Reliably signaled tops at 70+ | Stayed elevated without crash | Institutional buying smoothed volatility |
| Pi Cycle Top | Accurate within days of peak | False positives or delays | Macro events overrode technicals |
| Market Drivers | Retail FOMO | ETFs and corporate adoption | Shift to “store of value” narrative |
| Volatility Impact | High, retail-led swings | Moderated by big players | Less predictable with whales |
This table highlights how Bitcoin’s ecosystem has matured, making old indicators less reliable. Upgrading models might involve incorporating on-chain data like whale wallet movements or ETF inflows for better accuracy.
Use Cases & Application
Now, how does this play out in real life? For developers building trading bots or analytics tools, understanding indicator failures means integrating more data sources. Imagine coding a dashboard that pulls real-time ETF flows alongside RSI—suddenly, you’re not just reacting to price but to institutional sentiment. This enhances utility in DeFi apps, where accurate signals can optimize yield farming or lending protocols without over-relying on outdated tech.
For everyday users, it’s about education: Use these insights to track market health. A trader might benefit by combining indicators with news sentiment analysis, avoiding knee-jerk reactions to false tops. Technically, Bitcoin’s blockchain enables this through transparent ledgers—anyone can query on-chain metrics via tools like Glassnode or Dune Analytics. It’s not about getting rich quick; it’s about appreciating the tech’s resilience. Want to share this tech update on TikTok? Turn this text into a viral video using Revid.ai—quickly create engaging shorts to explain these concepts to your followers.
Educational Action Plan (How to Learn)
Ready to level up your knowledge without diving into risky moves? Focus on education first. Here’s a step-by-step plan:
Level 1 (Research/Observation): Start by tracking Bitcoin’s chart on free platforms like TradingView. Search for RSI or Pi Cycle indicators and overlay them on the 2025 price action. Read the Bitcoin whitepaper at bitcoin.org to understand its core mechanics—it’s only 9 pages! Observe how news events correlate with price without making any trades. This builds intuition on market mechanics.
Level 2 (Testnet/Experience): To get hands-on, explore Bitcoin testnets (like Testnet3) where you can simulate transactions with fake BTC. Use tools like Electrum wallet to practice sending/receiving, or build a simple script with libraries like python-bitcoinlib to query blockchain data. Emphasize small-scale learning—stick to test environments to avoid real risks. Dive into on-chain analytics; platforms like CryptoQuant offer free tiers to study metrics that outdated indicators missed.
If reading whitepapers makes you sleepy, let Nolang create a video summary for you—turn dense docs into digestible explainers.
Conclusion & Future Outlook
In summary, Bitcoin’s price top indicators failed this cycle not because they’re useless, but because the market has outgrown them. With institutional adoption and new dynamics, we’re seeing the need for upgraded models that blend technicals with macro and on-chain data. The potential rewards? A more mature ecosystem where Bitcoin solidifies as digital gold. But risks abound—volatility remains king, with crashes like 2025’s 21% November drop driven by liquidations and risk aversion. Always remember, crypto is unpredictable; learn the tech, understand the risks, and stay informed.
Smart investors automate. Set up alerts and workflows with Make.com so you never miss a critical update on indicators or market shifts.

👨💻 Author: SnowJon (Web3 Researcher / AI Power User)
Full-time employee by day, AI-powered content machine by night.
Currently studying at the University of Tokyo Blockchain Innovation Donation Course. I leverage AI to produce a massive amount of content across blogs and YouTube, aiming to bridge the gap between complex tech and everyday users.
(Note: This content was crafted with AI assistance but reviewed and finalized by a human.)
🛑 Important Disclaimer
This article is for entertainment and educational purposes only. I am an AI, not a financial advisor. Crypto assets are high-risk. Online gambling/casinos may be illegal in your country (e.g., Japan). Please verify your local laws. DYOR (Do Your Own Research) and never invest money you cannot afford to lose.
🛠️ Tools Mentioned: